Fig. 10.
Download original image
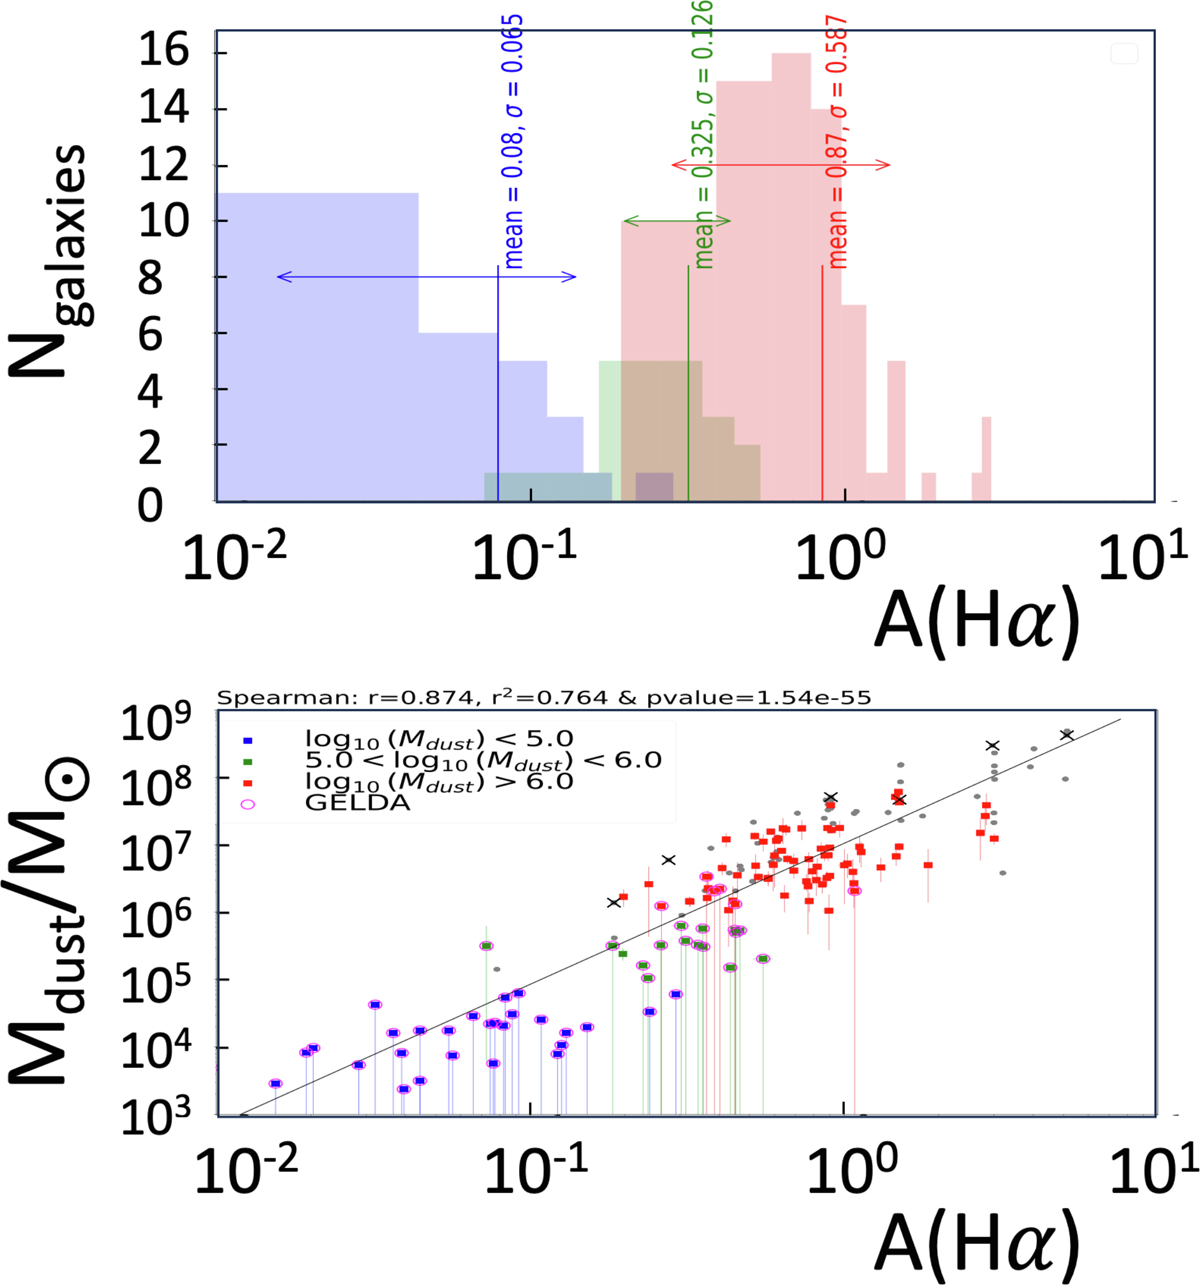
Correlation of estimated dust mass, Mdust, with dust attenuation, A(Hα). The most relevant parameter to predict the dust mass is the dust attenuation A(Hα) derived from the Hα/Hβ Balmer decrement. The correlation with A(Hα) alone accounts for 76% of the variation in Mdust. The spectral information brought by NIRSpec is thus fundamental to estimating the dust masses. Blue, green, and red symbols, respectively, mean Mdust≤105 M⊙, 105 < Mdust≤106 M⊙, and Mdust > 106, while magenta circles show GELDAs.
Current usage metrics show cumulative count of Article Views (full-text article views including HTML views, PDF and ePub downloads, according to the available data) and Abstracts Views on Vision4Press platform.
Data correspond to usage on the plateform after 2015. The current usage metrics is available 48-96 hours after online publication and is updated daily on week days.
Initial download of the metrics may take a while.