Fig. 12.
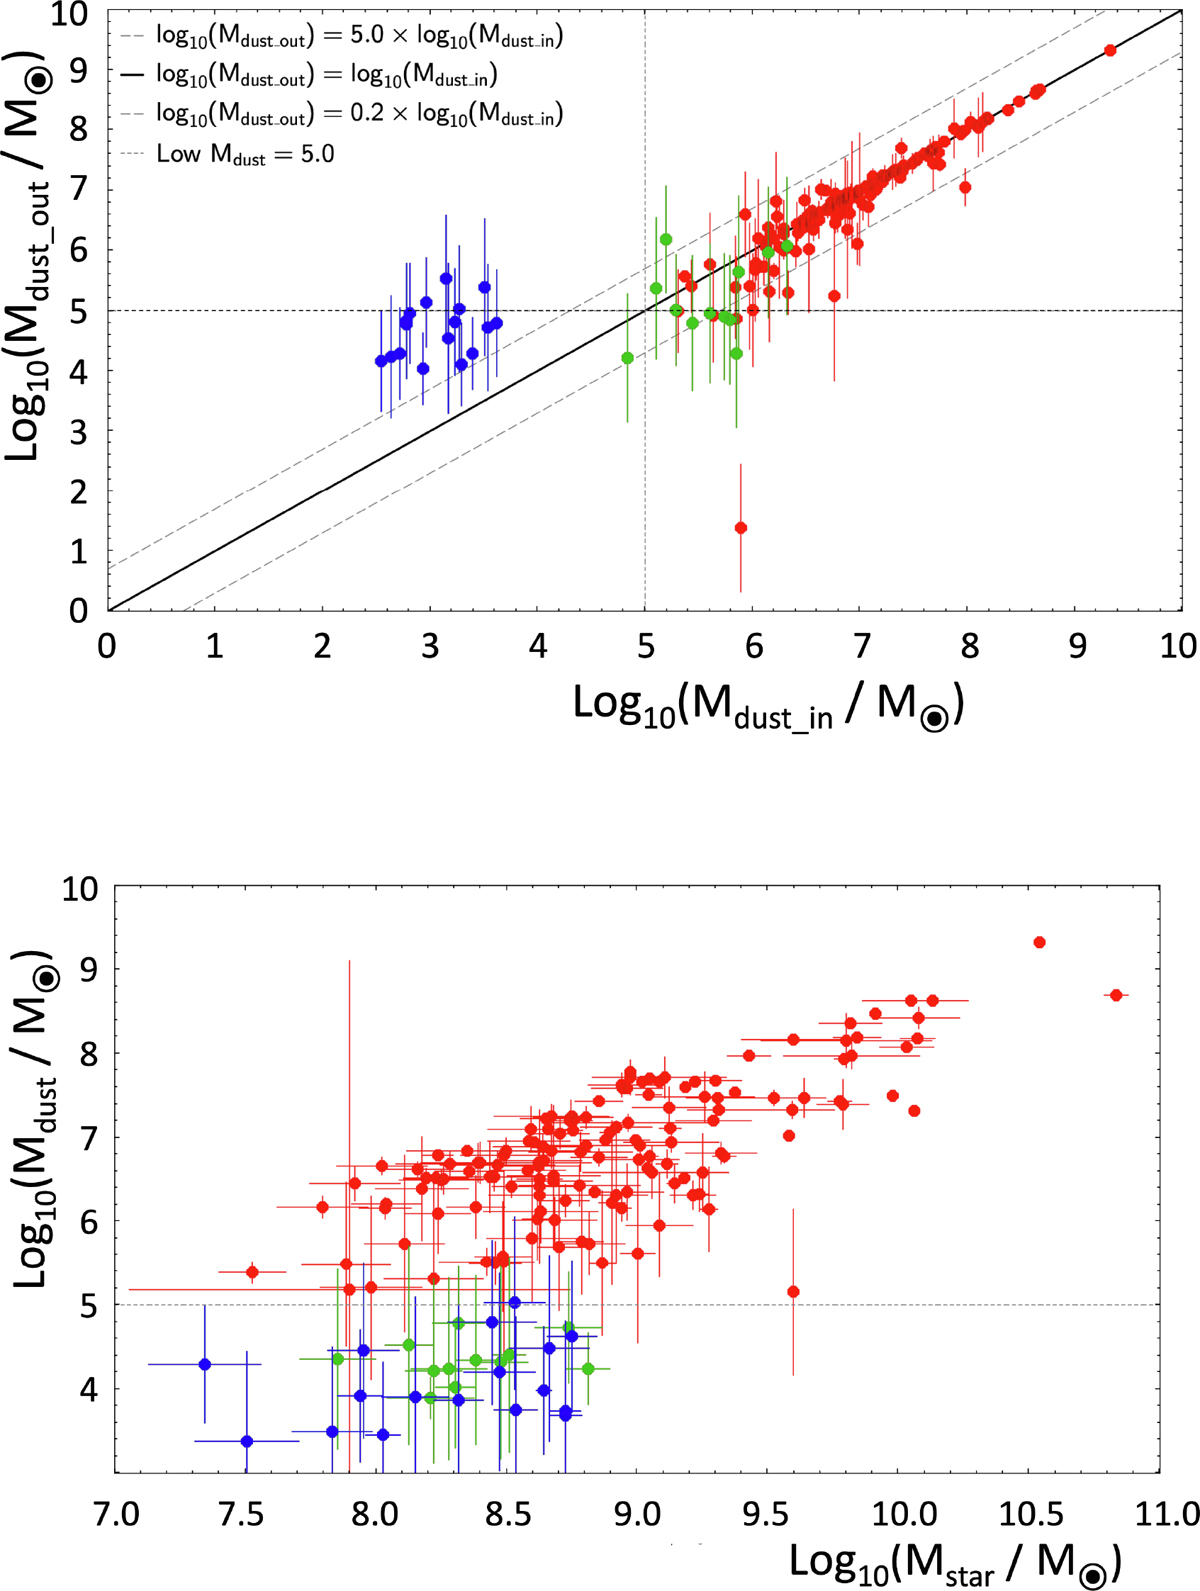
Download original image
Use of mock analysis to estimate minimum dust mass that we can actually estimate using our approach. Top: x-axis shows modelled Mdust computed from the best-fit models and for each of our galaxies. CIGALE is able to recover these input dust masses (y-axis) by fitting the mock data down to about log10(Mdust) = 5.0. Parts of the objects in green and all the objects in blue should thus be considered as upper limits. These objects that are the ones identified as transitioners between the upper sequence and a possible lower sequence are well below the prime sequence (red dots). Bottom: log10(Mdust) versus log10(Mstar) diagram showing that the lowest dust masses correspond to the lowest stellar masses. However, for the same stellar-mass range, we do observe a wide range of dust masses. Normal, mid, and low Mdust mean Mdust≤105 M⊙, 105 < Mdust≤106 M⊙, and Mdust > 106 M⊙, respectively.
Current usage metrics show cumulative count of Article Views (full-text article views including HTML views, PDF and ePub downloads, according to the available data) and Abstracts Views on Vision4Press platform.
Data correspond to usage on the plateform after 2015. The current usage metrics is available 48-96 hours after online publication and is updated daily on week days.
Initial download of the metrics may take a while.