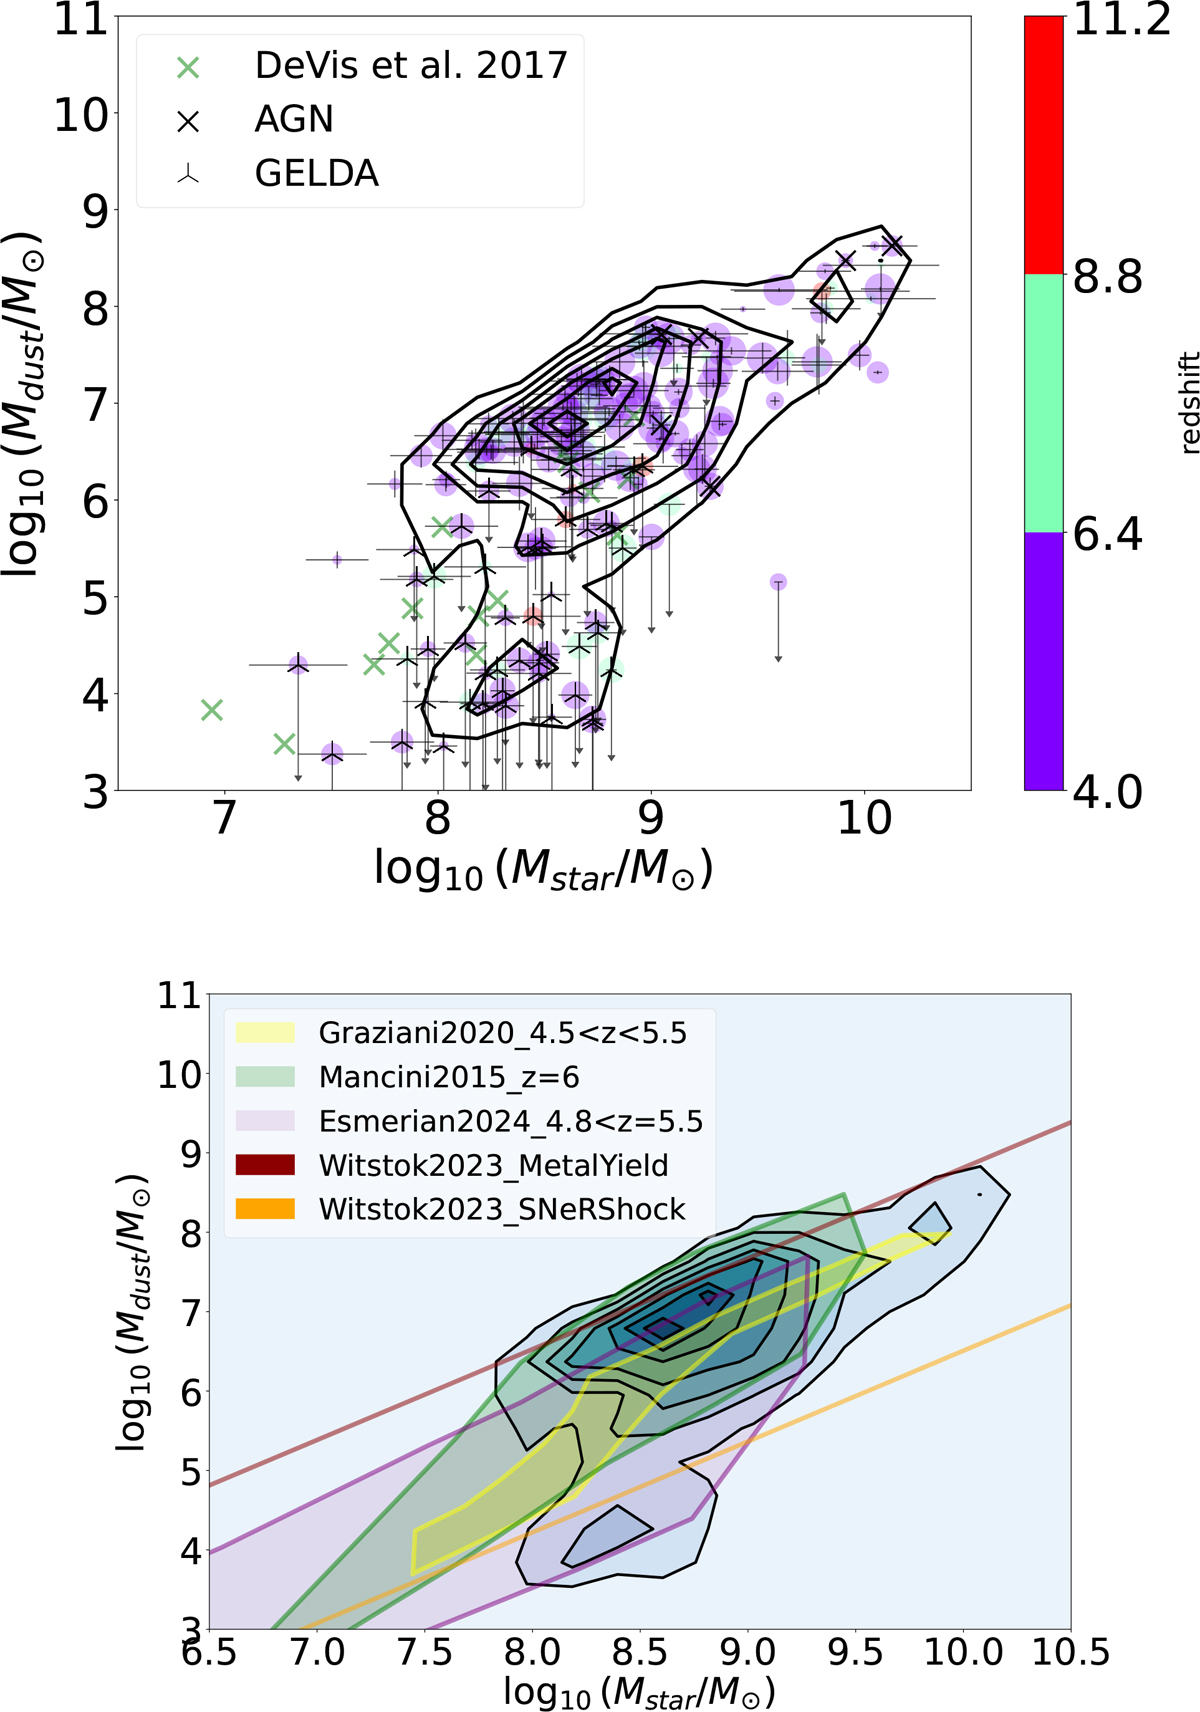
Fig. 16.
Download original image
Mdust as function of Mstar. Top: Dots are colour-coded according to redshift. The size of the symbols provides us with information on 12 + log10(O/H), with the largest sizes corresponding to the largest metallicities. We show density contours as heavy black lines. At log10 (Mstar) ∼ 108−9 M⊙, we observe a transition from an apparent high sequence to a lower one. The upper sequence is similar to that observed at low redshift (e.g. Beeston et al. 2018). The lower objects have not been identified before in this (Mdust vs. Mstar) diagram, except for a few objects (green crosses, De Vis et al. 2017). They share the same location in the plot and are extracted from a sub-sample of galaxies in an HI-selected local-galaxy sample from GAMA and H-ATLAS. Bottom: Models plotted on density contours. Hydrodynamical code dustygadget (Graziani et al. 2020) is in yellow, a cosmological hydrodynamical simulation coupled with a chemical evolution model (Mancini et al. 2015) is in green, and a suite of cosmological, fluid-dynamical simulations of galaxies (Esmerian & Gnedin 2024) are in pink. The upper brown line (Witstok et al. 2023) shows where galaxies with ISM-grown grains should be. The bottom orange line corresponds to galaxies with only stardust (Witstok et al. 2023) that underwent a 95% destruction of grains by reverse SNae shock (Witstok et al. 2023). The objects observed at the bottom of the top panel correspond to the transition between galaxies only containing stardust to galaxies dominated by ISM dust.
Current usage metrics show cumulative count of Article Views (full-text article views including HTML views, PDF and ePub downloads, according to the available data) and Abstracts Views on Vision4Press platform.
Data correspond to usage on the plateform after 2015. The current usage metrics is available 48-96 hours after online publication and is updated daily on week days.
Initial download of the metrics may take a while.