Fig. 18.
Download original image
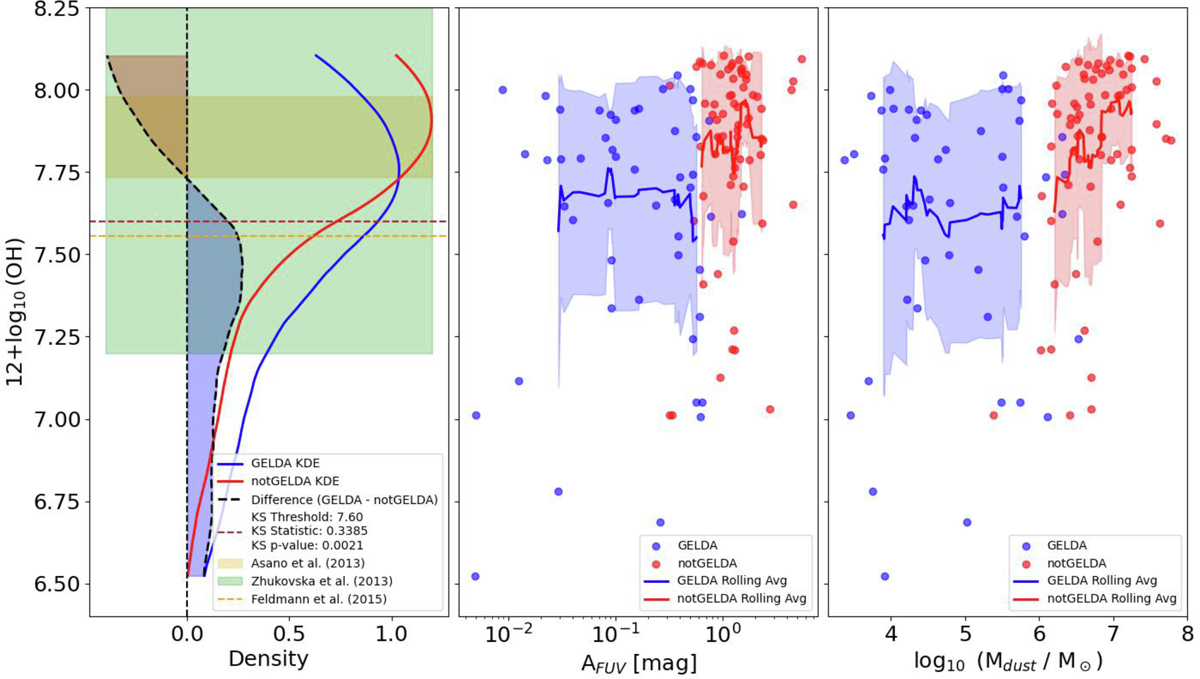
Distribution of metallicity for GELDAs and non-GELDAs. The left panel presents the kernel density estimation (KDE) with an Epanechnikov kernel and a bandwidth = 0.5 both for GELDAs (solid blue line) and non-GELDAS (solid red line). The dashed black lines show the differences. The blue and red shaded areas show where GELDAs and non-GELDAs are the dominant population, respectively. We clearly see that GELDAs preferentially cluster at low metallicity, with a threshold estimated at 12 + log10(O/H) = 7.60. The Kolmogorov-Smirnov test confirms that the difference is highly significant. We show predictions for the transition from stardust to ISM from some of the models (see main text for more works): Asano et al. (2013) (orange shaded area), Zhukovska (2014) (green shaded area), and Feldmann (2015) (dashed orange line). Rémy-Ruyer et al. (2014) found a larger scatter in their dust-to-gas ratio covers almost the same metallicity range: 7.2 ≲ 12 + log10(O/H) ≲ 8.5. All of these metallicities are in good agreement with our estimated threshold. The middle and right panels show the rolling averages (window size = 15) of the metallicity as a function of AFUV and log10 (Mdust). Both panels confirm the difference between GELDAs (blue) and non-GELDAS (red).
Current usage metrics show cumulative count of Article Views (full-text article views including HTML views, PDF and ePub downloads, according to the available data) and Abstracts Views on Vision4Press platform.
Data correspond to usage on the plateform after 2015. The current usage metrics is available 48-96 hours after online publication and is updated daily on week days.
Initial download of the metrics may take a while.