Fig. C.3.
Download original image
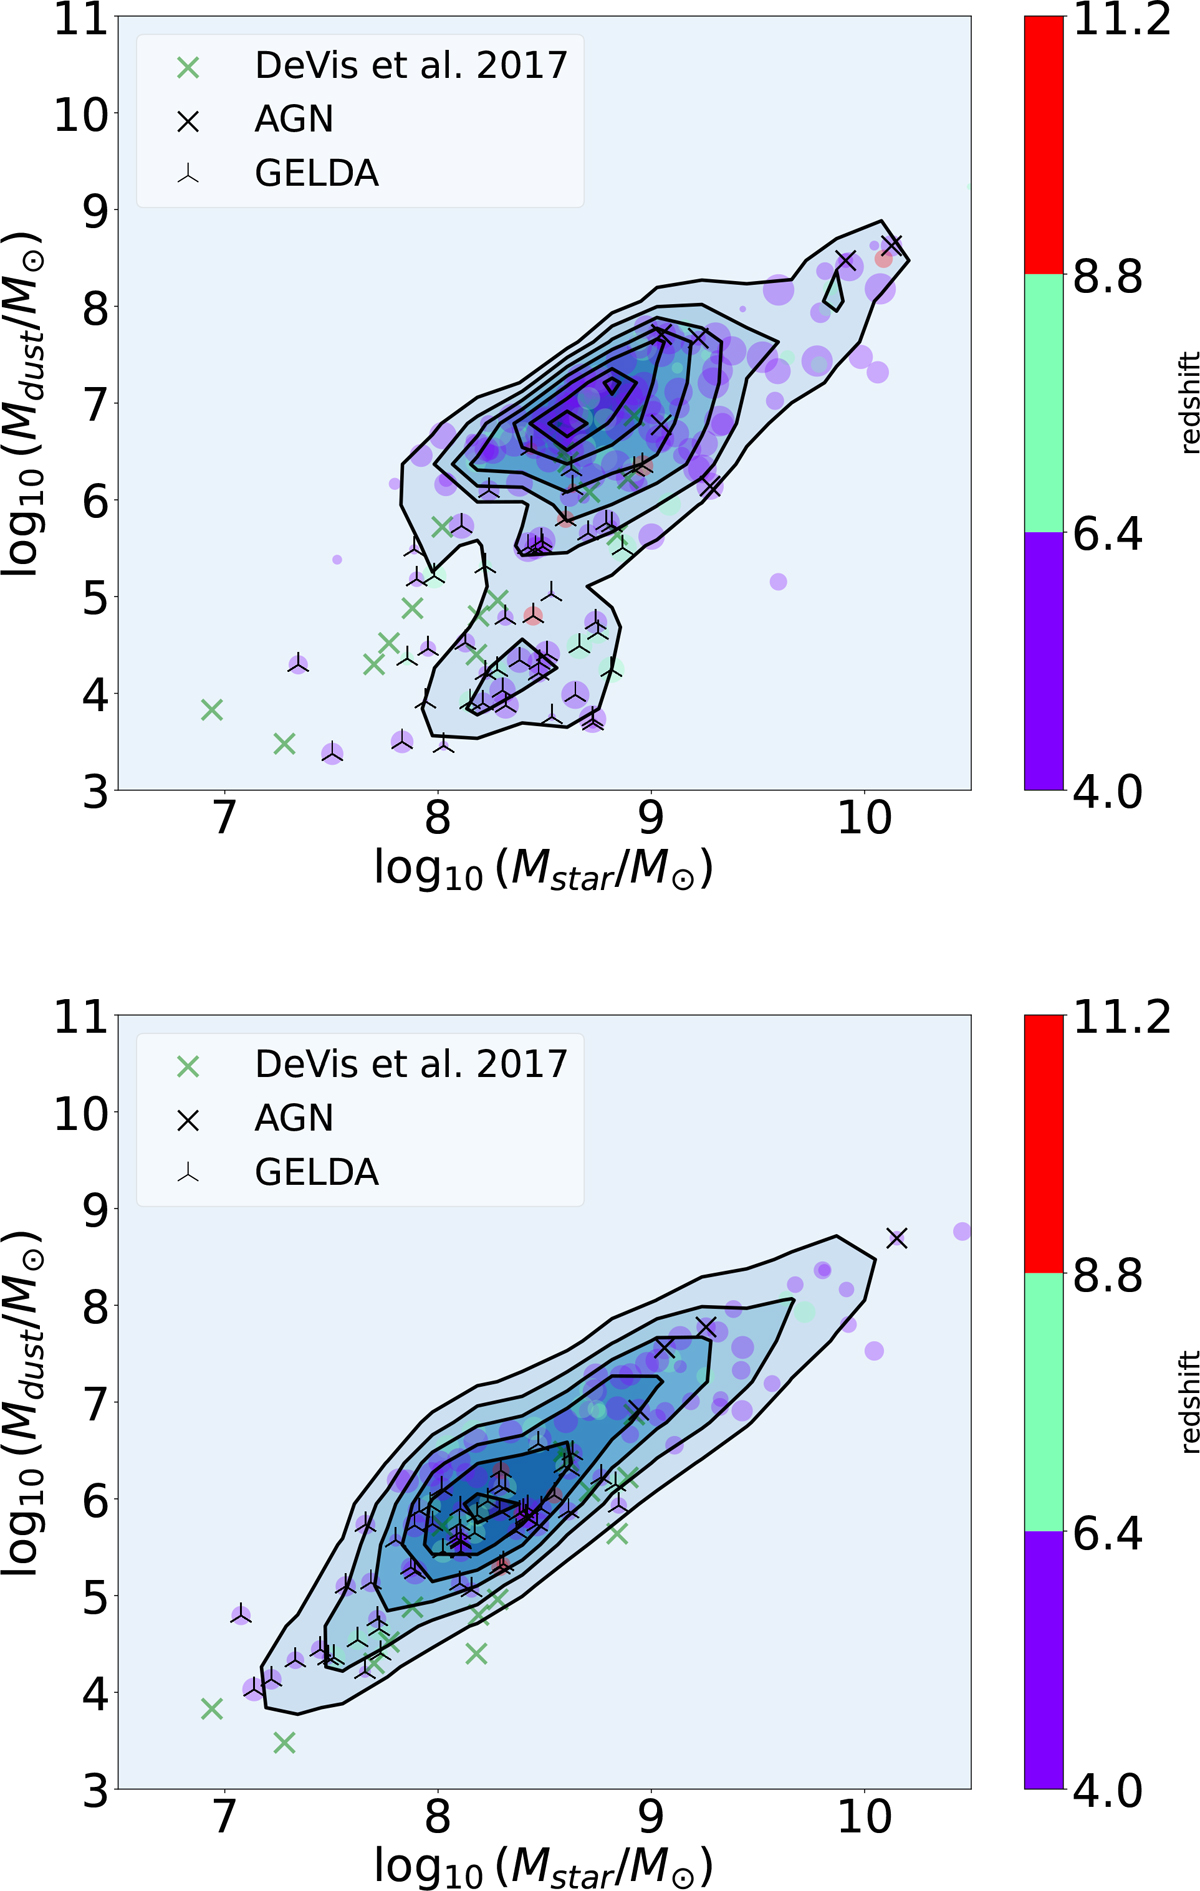
Test on the stability of the results with the type of data used: Top - This figure is created by fitting the spectrophotometric data, as in Fig. 16 and Fig. C.2, except that we do not use the sub-mm ones. The trend observed in this case is almost identical, which confirms the less important role of the sub-mm data in separating the two parallel sequences. Bottom - This figure is created by only fitting the photometric data, including the sub-mm ones but not the spectroscopic one. The trend observed in this case is different from when we make use of the NIRSpec spectra. We still do see a small decrease at lower stellar mass, even though the less-marked downturn suggests that without spectroscopy, some strong spectral information, and especially the line ratios, is missing. However, the photometric data still bring an information on the dust attenuation because of the UV slope βFUV. The correlation of βFUV with the dust mass is much less significant, and leads to this smaller difference in dust mass, even at low stellar masses which makes the second lower sequence less prominent.
Current usage metrics show cumulative count of Article Views (full-text article views including HTML views, PDF and ePub downloads, according to the available data) and Abstracts Views on Vision4Press platform.
Data correspond to usage on the plateform after 2015. The current usage metrics is available 48-96 hours after online publication and is updated daily on week days.
Initial download of the metrics may take a while.