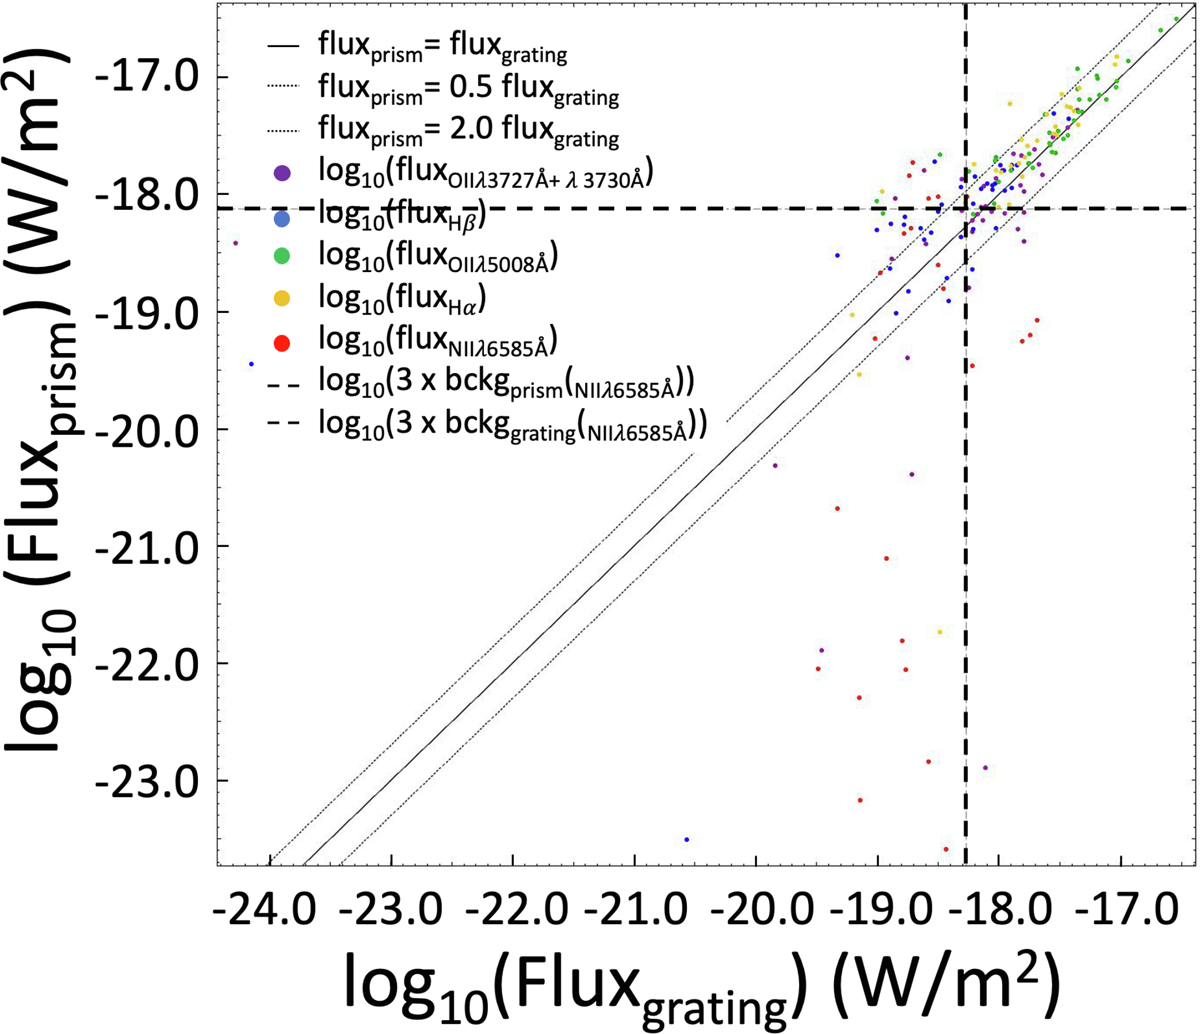
Fig. 3.
Download original image
Comparison of fluxes computed by CIGALE (Fluxprism) with Gaussian fitting of the lines observed in the grating configuration (Fluxgrating) for objects observed in both configurations. The points corresponding to each emission line are colour-coded to better identify each species (see inside caption). The diagonal line shows the 1-to-1 relation (Fluxprism = Fluxgrating), while the dashed lines present offsets (Fluxprism = 0.5 Fluxgrating) and (fluxprism = 2.0 Fluxgrating). The horizontal and vertical dashed lines show the level of the 3σ background around the [NII] + Hα lines.
Current usage metrics show cumulative count of Article Views (full-text article views including HTML views, PDF and ePub downloads, according to the available data) and Abstracts Views on Vision4Press platform.
Data correspond to usage on the plateform after 2015. The current usage metrics is available 48-96 hours after online publication and is updated daily on week days.
Initial download of the metrics may take a while.