Fig. 4.

Download original image
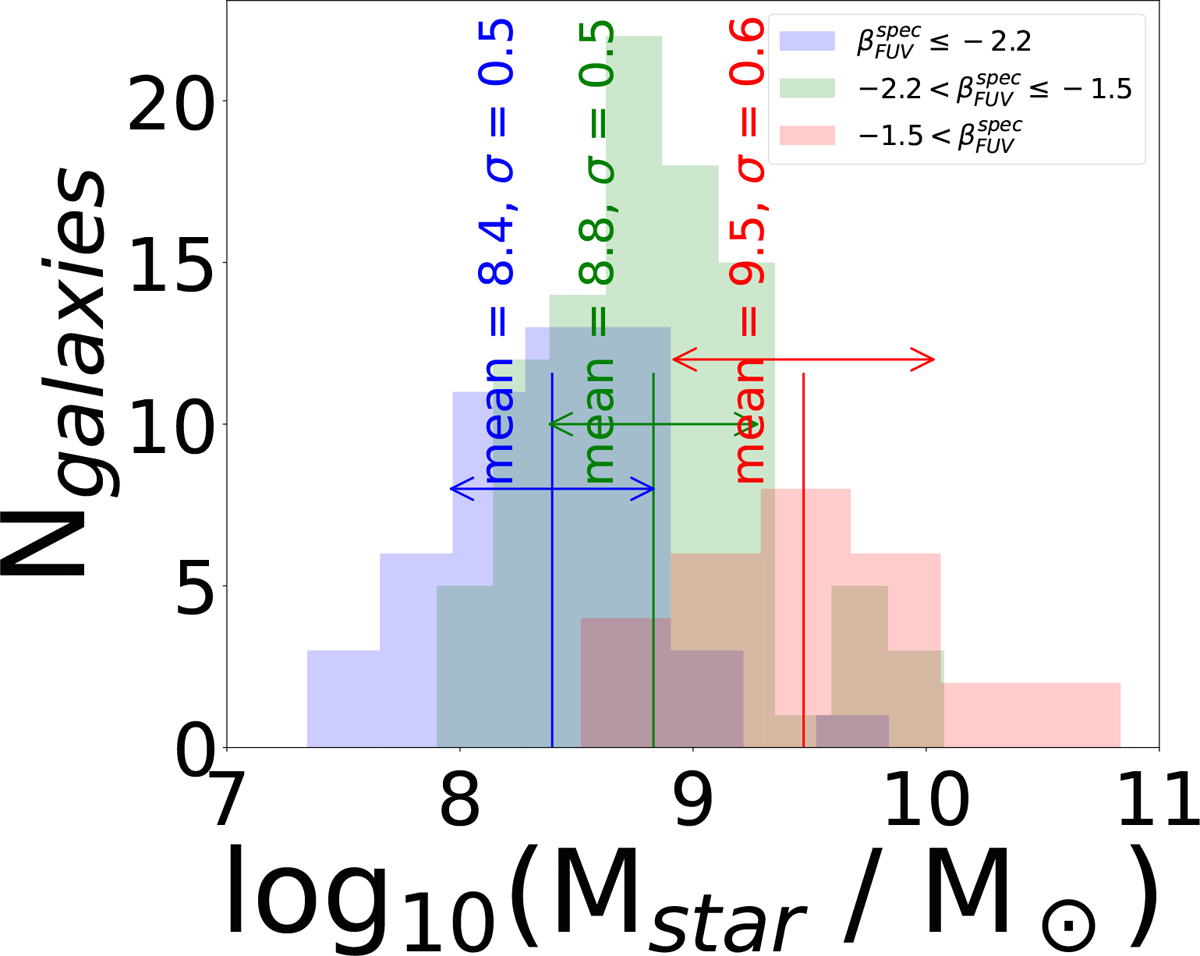
Distribution of stellar masses derived by fitting spectrophotometric energy distributions of our galaxy sample. In this plot, we only show galaxies with βFUV derived from CIGALE's fits. The range of stellar masses reaches Mstar values as low as a few 107 M⊙. The colour-coding shows that the least massive galaxies clearly have bluer UV slopes (βFUV≤−2.2), while the most massive galaxies have redder slopes (−1.5<βFUV), as expected from the dependence of UV dust attenuation on stellar mass (see e.g. Bogdanoska & Burgarella 2020; Weibel et al. 2024; Bouwens et al. 2016). The vertical numbers show the mean stellar mass for each sample.
Current usage metrics show cumulative count of Article Views (full-text article views including HTML views, PDF and ePub downloads, according to the available data) and Abstracts Views on Vision4Press platform.
Data correspond to usage on the plateform after 2015. The current usage metrics is available 48-96 hours after online publication and is updated daily on week days.
Initial download of the metrics may take a while.


