Fig. 5.
Download original image
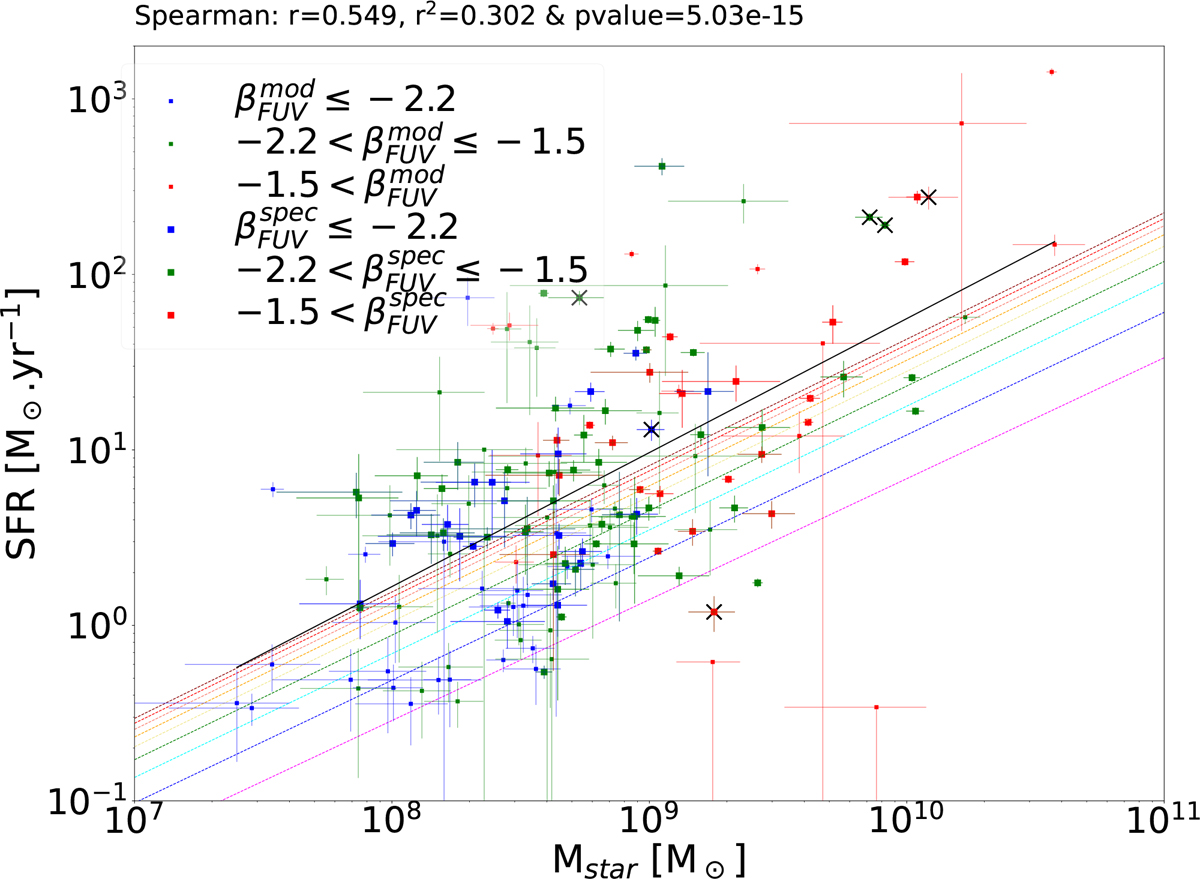
Star formation rate as function of stellar mass for our galaxy sample. For some galaxies, the observed spectra are not good enough to provide a reliable fit of the spectrum (f![]() ) for the UV slope. For those galaxies, we rely on CIGALE's fits. Here, the larger symbols correspond to UV slopes spectroscopically estimated from the observed data, while the smaller symbols are from the CIGALE fits. Blue, green, and red symbols, respectively, show galaxies with blue, intermediate, and red slopes (see inside caption). Whatever the origin of the UV slopes, the lower mass galaxies present a bluer UV slope, while the more massive ones have are redder. In this plot, we superimpose the best-fit MS from Speagle et al. (2014) in the range z = 4–12, colour-coded from magenta to dark red (bottom to top).
) for the UV slope. For those galaxies, we rely on CIGALE's fits. Here, the larger symbols correspond to UV slopes spectroscopically estimated from the observed data, while the smaller symbols are from the CIGALE fits. Blue, green, and red symbols, respectively, show galaxies with blue, intermediate, and red slopes (see inside caption). Whatever the origin of the UV slopes, the lower mass galaxies present a bluer UV slope, while the more massive ones have are redder. In this plot, we superimpose the best-fit MS from Speagle et al. (2014) in the range z = 4–12, colour-coded from magenta to dark red (bottom to top).
Current usage metrics show cumulative count of Article Views (full-text article views including HTML views, PDF and ePub downloads, according to the available data) and Abstracts Views on Vision4Press platform.
Data correspond to usage on the plateform after 2015. The current usage metrics is available 48-96 hours after online publication and is updated daily on week days.
Initial download of the metrics may take a while.