Fig. 6.
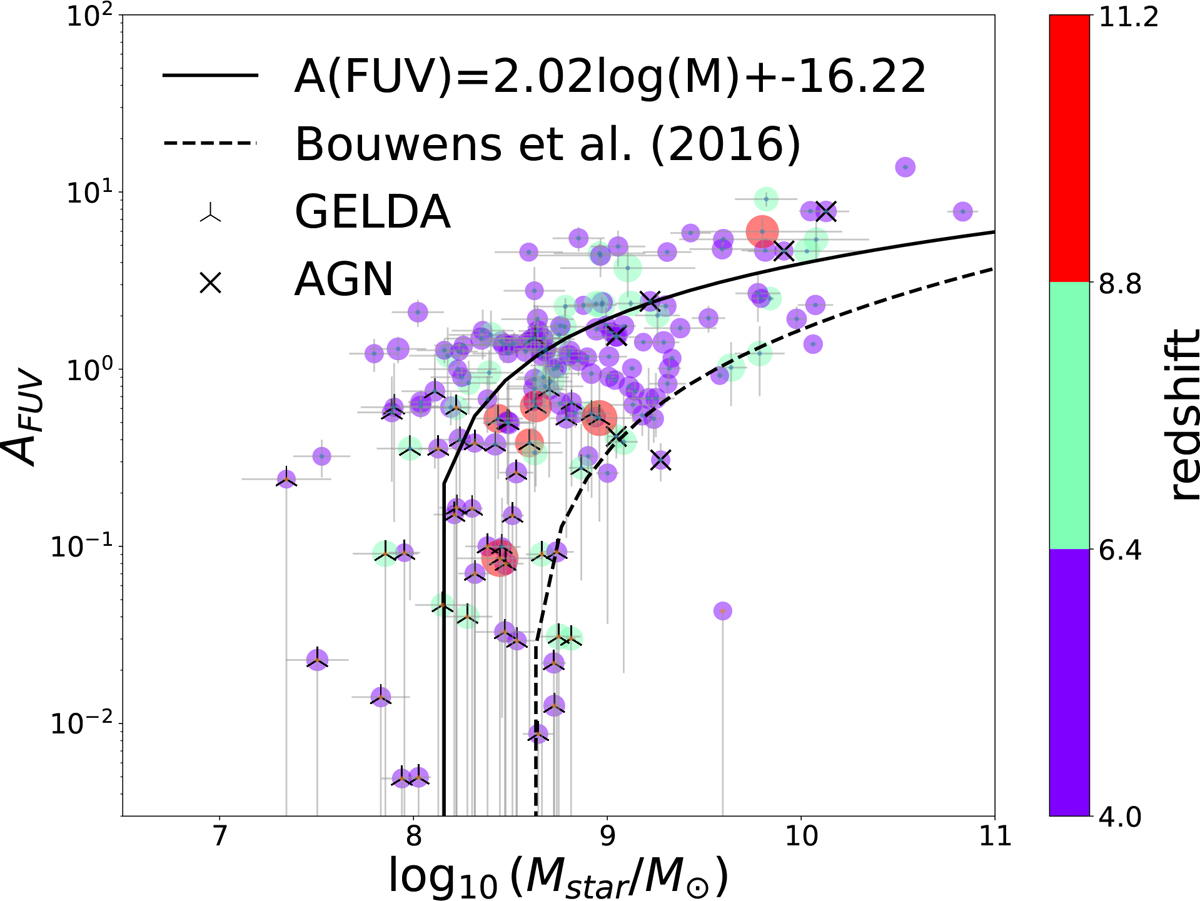
Download original image
Far-UV dust attenuation AFUV as a function of stellar mass, log10(Mstar). The symbols are colour-coded and sized with the redshift. The red objects correspond to the highest redshift bin defined in this paper (z > 8.8). The majority of highest-redshift GELDAs (5 out of 6) are found in the low-AFUV part of the plot. This sample of galaxies at z > 8.8 is small, but it might confirm an expected decreasing evolution of the dust attenuation with the redshift. The dashed line is the ‘consensus’ law from Bouwens et al. (2016), while the continuous line is the best linear fit (AFUV vs log10(Mstar)) to the present data. GELDAs are shown with an upside-down Y, and AGNs are shown with crosses.
Current usage metrics show cumulative count of Article Views (full-text article views including HTML views, PDF and ePub downloads, according to the available data) and Abstracts Views on Vision4Press platform.
Data correspond to usage on the plateform after 2015. The current usage metrics is available 48-96 hours after online publication and is updated daily on week days.
Initial download of the metrics may take a while.