Fig. 8.

Download original image
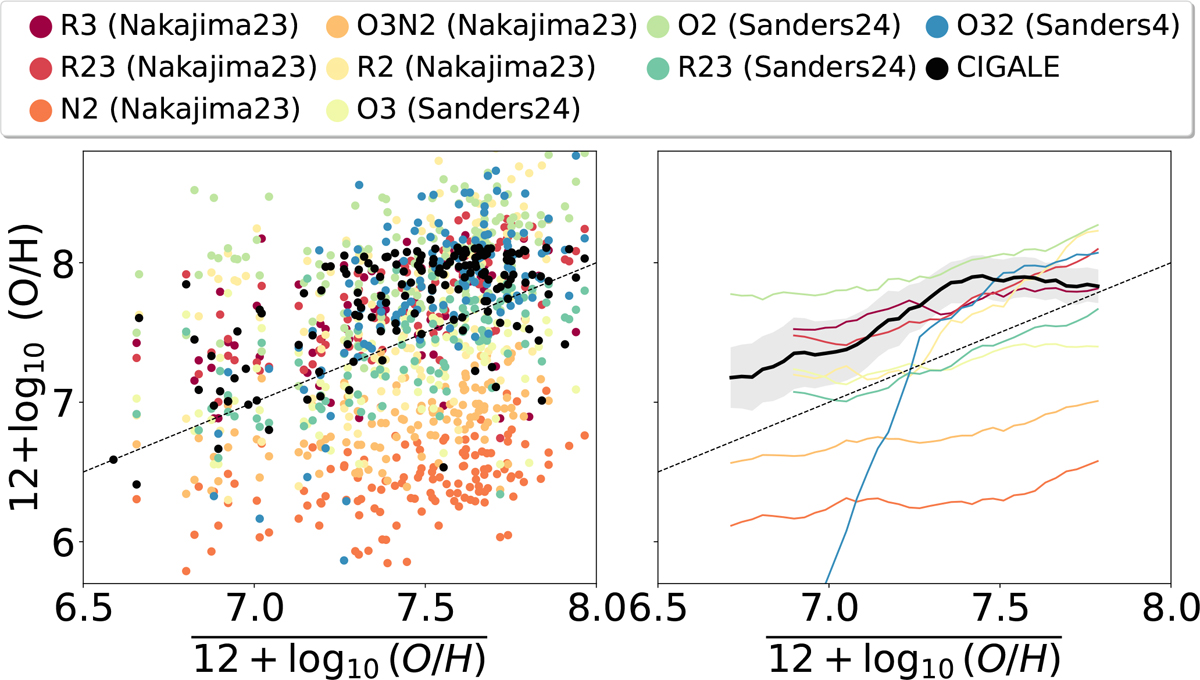
Direct comparison of metallicities (12 + log10(O/H) defined in Eq. (1). Left: this panel shows the metallicities derived using various published calibrations as a function of the mean metallicities computed from each measured galaxy. The dashed black line is the 1-to-1 relation. For a given metallicity on an x-axis, we could get a very wide range on the y-axis depending on which line ratio is used. The black dots are the metallicities from CIGALE. The red-orange ones from Nakajima et al. (2023) and the blue-green one from Sanders et al. (2024). The color coding is given in the legend inside the plot. Right: this panel presents the same information with a rolling average. Most of the metallicity values agree within about ±0.5 dex and the metallicities from CIGALE are approximately in the middle range. However, we notice that the ones involving the nitrogen lines lead to much lower metallicities (see text for more details.
Current usage metrics show cumulative count of Article Views (full-text article views including HTML views, PDF and ePub downloads, according to the available data) and Abstracts Views on Vision4Press platform.
Data correspond to usage on the plateform after 2015. The current usage metrics is available 48-96 hours after online publication and is updated daily on week days.
Initial download of the metrics may take a while.


