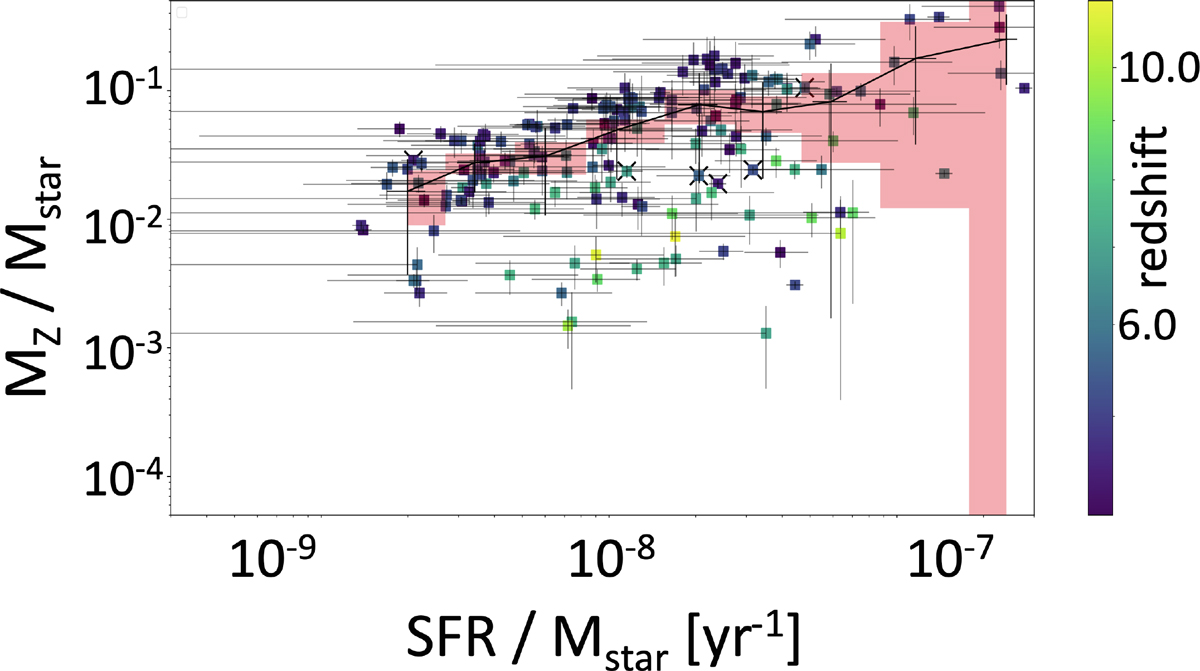
Fig. 9.
Download original image
Evolution of metal-to-stellar mass ratio as function of specific star formation rate in this metal formation rate diagram (MFRD) presented in the same way we defined the dust formation rate diagram (DFRD) showing how the specific dust mass (Mdust/Mstar) changes with the specific star formation rate (SFR/Mstar) in Burgarella et al. (2022). This type of diagram is normalised to Mstar and allows a better comparison between galaxies. The symbols are colour-coded with the redshift. The pink shaded area presents the 2-σ confidence interval for the distribution in MZ/Mstar, and the solid black line shows the rolling average. We observe a decreasing trend with decreasing sSFR. The highest redshift galaxies are located in the lowest part of the plot.
Current usage metrics show cumulative count of Article Views (full-text article views including HTML views, PDF and ePub downloads, according to the available data) and Abstracts Views on Vision4Press platform.
Data correspond to usage on the plateform after 2015. The current usage metrics is available 48-96 hours after online publication and is updated daily on week days.
Initial download of the metrics may take a while.