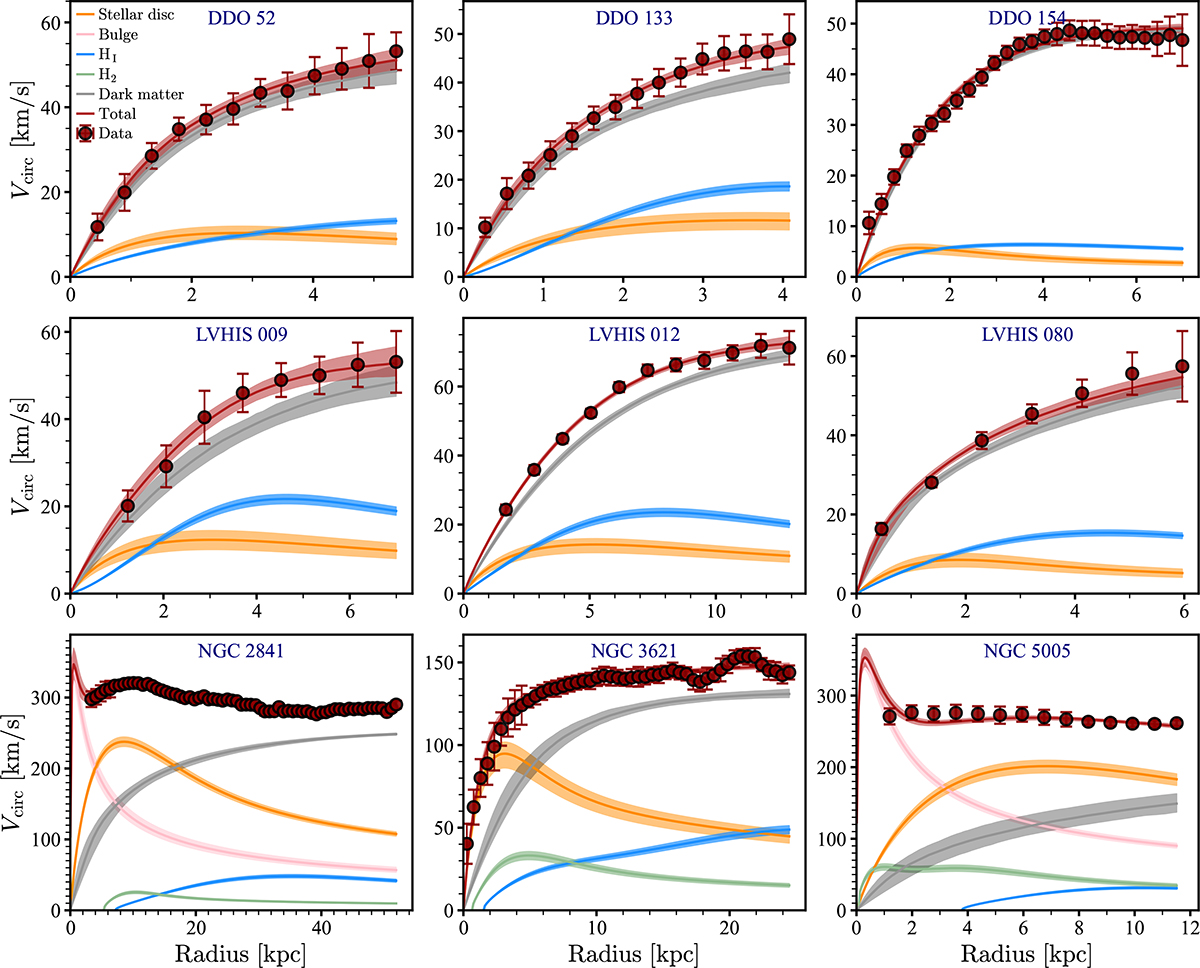
Fig. 3.
Download original image
Mass models of nine representative galaxies in our sample (similar plots for our full sample and the corresponding posterior distributions are available in this link). In each panel, the observed circular speed profiles are shown with dark red circular markers. The colour lines and bands represent the gravitational contribution from the stellar disc (orange), bulge (pink, if present), H I (blue), H2 (green, if present) and dark matter (grey) to the total mass model (red) and their corresponding 1σ confidence bands.
Current usage metrics show cumulative count of Article Views (full-text article views including HTML views, PDF and ePub downloads, according to the available data) and Abstracts Views on Vision4Press platform.
Data correspond to usage on the plateform after 2015. The current usage metrics is available 48-96 hours after online publication and is updated daily on week days.
Initial download of the metrics may take a while.