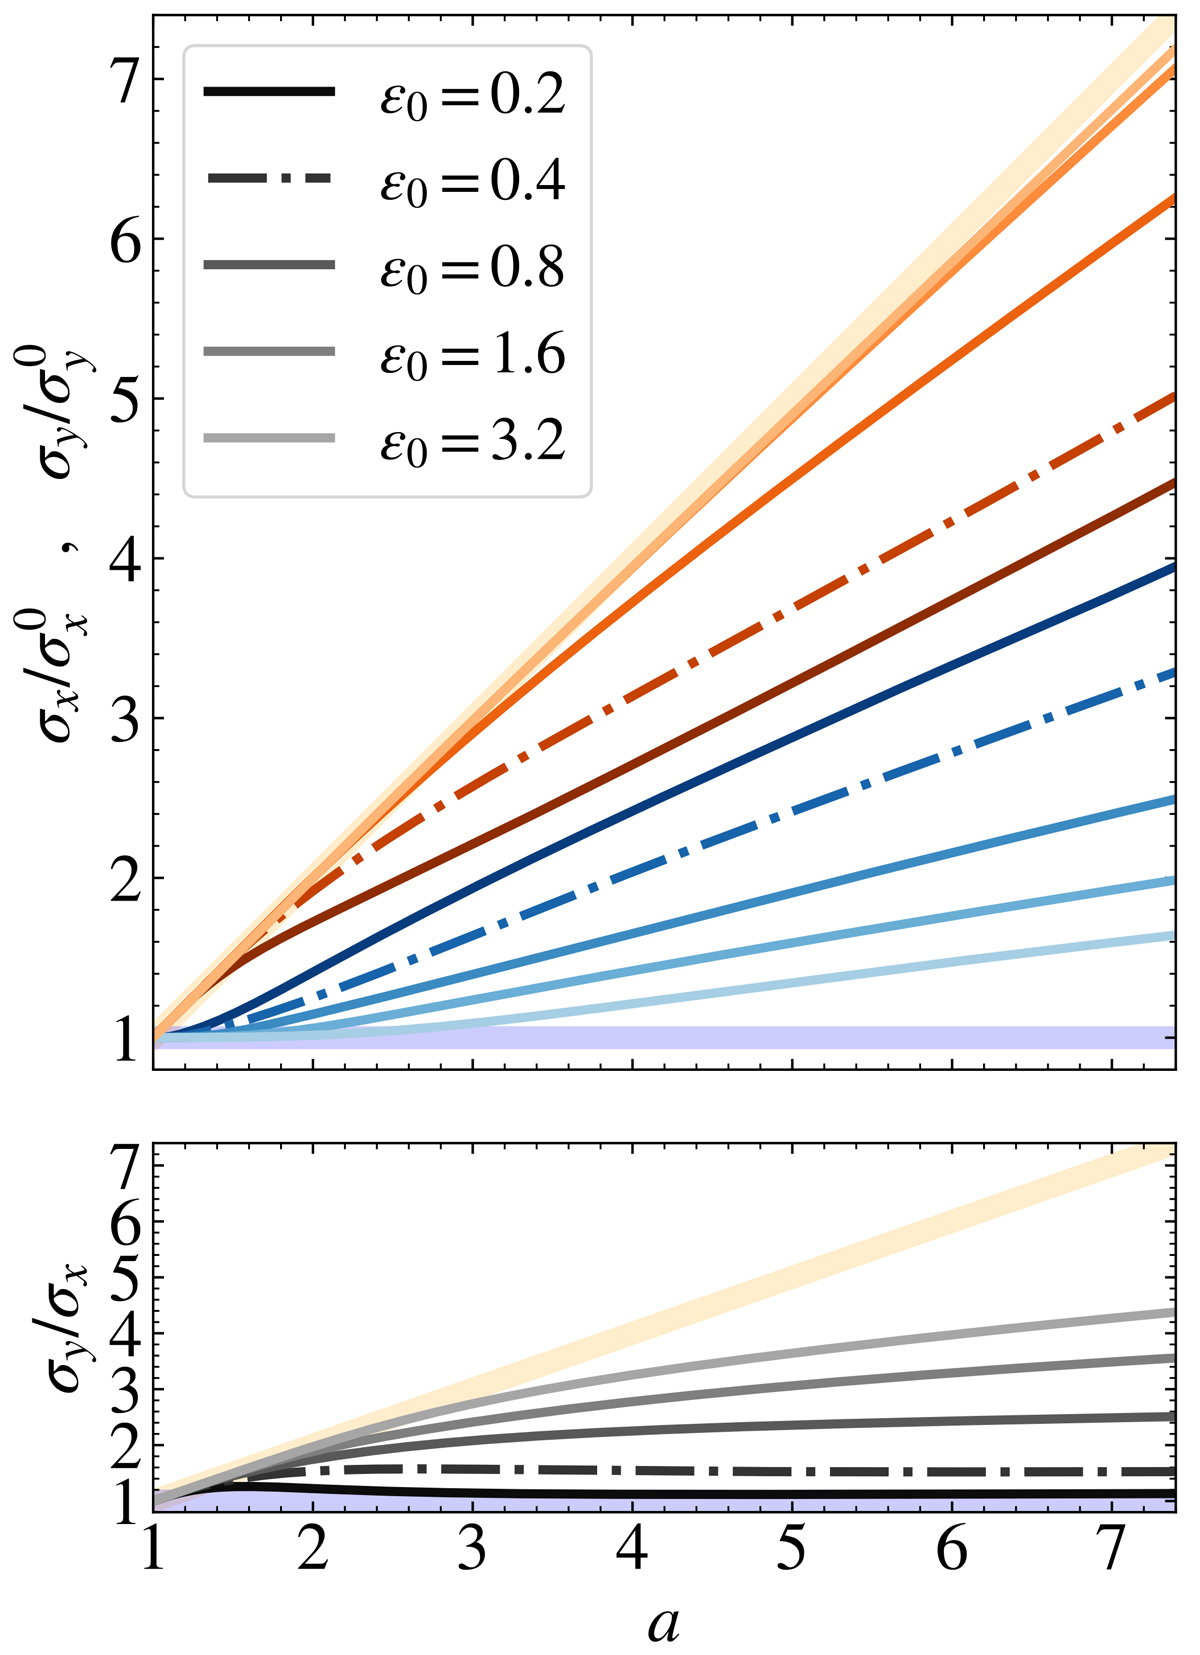
Fig. 6.
Download original image
Heliospheric evolution of the flux rope size estimates σx and σy (top panel) and the y-x aspect ratio (bottom panel) for runs A2, A3, A4, A5, and A6, that is, increasing ɛ0. Lighter shades represent increasing parameter values. Run A3 is represented as a dash-dotted line. The light blue (orange) broad line represents the expected ‘kinematic’ trend along x (y).
Current usage metrics show cumulative count of Article Views (full-text article views including HTML views, PDF and ePub downloads, according to the available data) and Abstracts Views on Vision4Press platform.
Data correspond to usage on the plateform after 2015. The current usage metrics is available 48-96 hours after online publication and is updated daily on week days.
Initial download of the metrics may take a while.