Fig. 5
Download original image
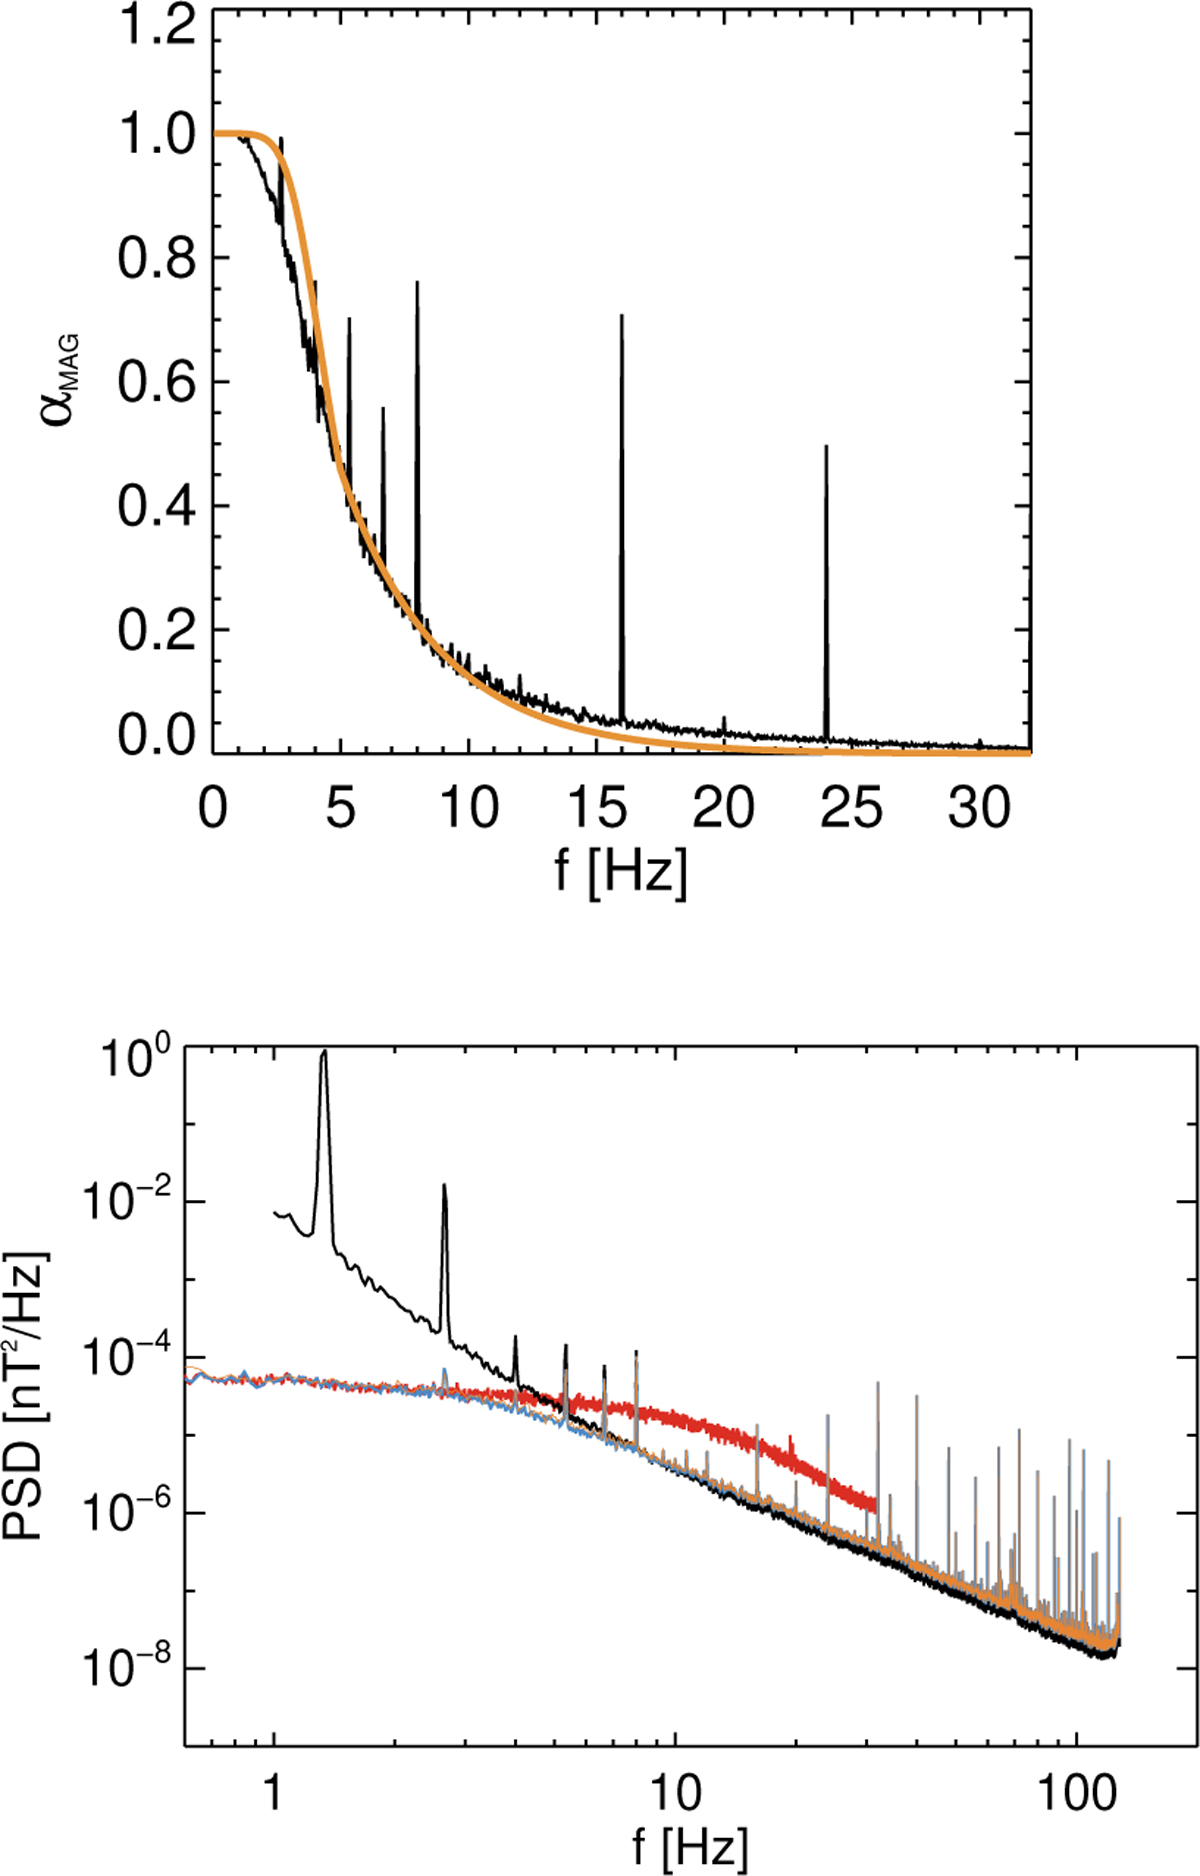
Top panel: αmag used for the merged magnetic field (orange) compared to Eq. (3) (black). Bottom panel: MAG noise (red), SCM noise (black), and computed (blue) and observed (orange) merged noise for the Xsrf component (worst case for SCM). Note that at high frequencies the merged magnetic field has a noise value that 14% above the one from SCM data alone because of the increase in SCM amplitudes to match MAG amplitudes at low frequencies.
Current usage metrics show cumulative count of Article Views (full-text article views including HTML views, PDF and ePub downloads, according to the available data) and Abstracts Views on Vision4Press platform.
Data correspond to usage on the plateform after 2015. The current usage metrics is available 48-96 hours after online publication and is updated daily on week days.
Initial download of the metrics may take a while.