Fig. 17.
Download original image
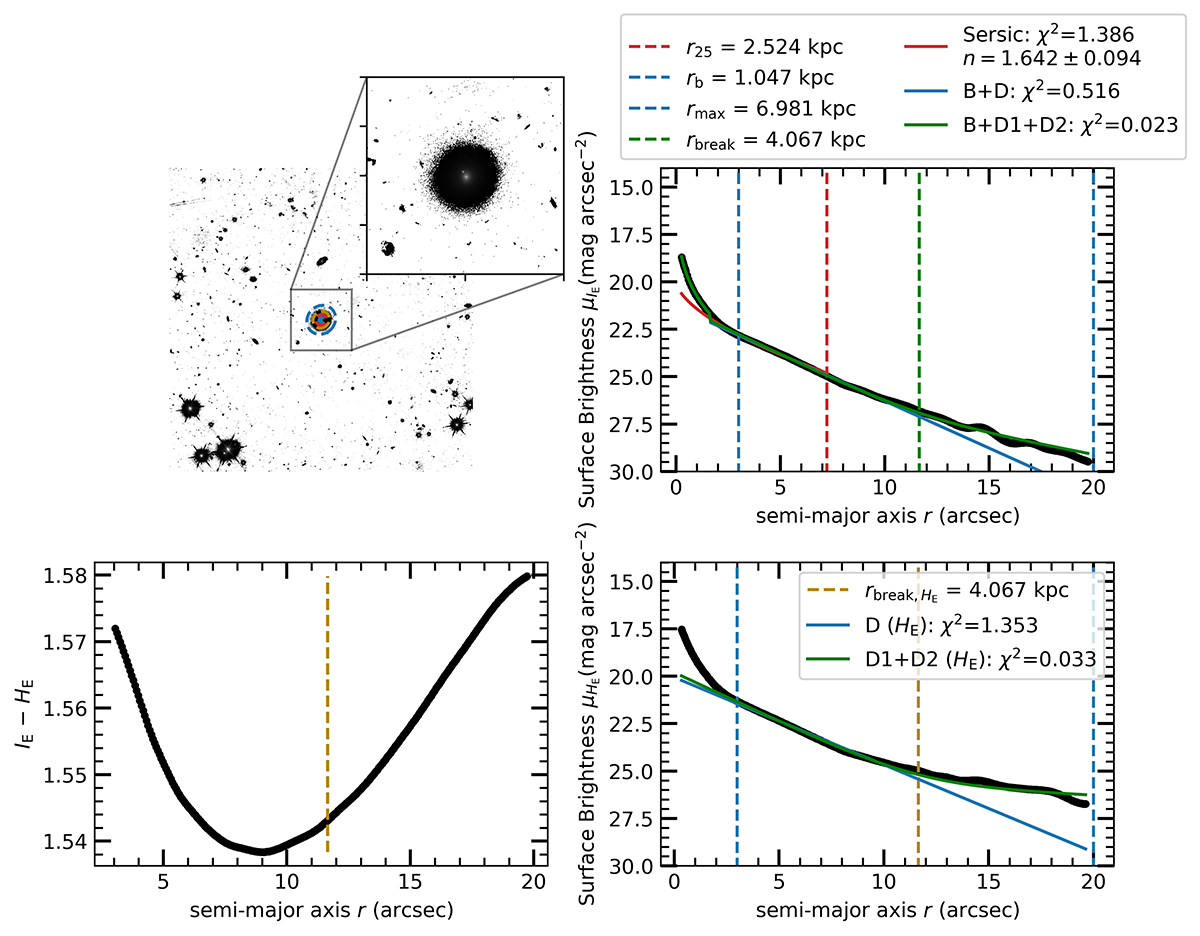
Profile of the galaxy SDSS 1237661122387969061. Top Left Panel: Image of the galaxy with associated radii indicated by ellipses of different colours: green/yellow for the break positions in the surface brightness profiles of IE (μIE) and HE (μHE) bands, red for the radius at ![]() , and blue for the boundary regions of interest in semi-major axis r between [rb, rmax]. Top Right Panel: Surface brightness profile (μIE) versus semi-major axis (r) of the fitted ellipses in the IE band. Solid lines indicate the fitted models: Single Sérsic model in red, bulge/disc decomposition model in blue, bulge/disc1/disc2 decomposition model in green. The vertical dashed lines indicate in blue the boundary of the region of interest in r where the break may potentially be found, in green the break position, and in red the radius corresponding to
, and blue for the boundary regions of interest in semi-major axis r between [rb, rmax]. Top Right Panel: Surface brightness profile (μIE) versus semi-major axis (r) of the fitted ellipses in the IE band. Solid lines indicate the fitted models: Single Sérsic model in red, bulge/disc decomposition model in blue, bulge/disc1/disc2 decomposition model in green. The vertical dashed lines indicate in blue the boundary of the region of interest in r where the break may potentially be found, in green the break position, and in red the radius corresponding to ![]() . Bottom Left Panel:IE−HE colour as a function of the semi-major axis r between [rb, rmax]. Bottom Right Panel: Surface brightness profile μHE versus semi-major axis (r) of the fitted ellipses. The solid lines indicate the fitted models after the radius of the bulge: disc model in blue, disc1/disc2 model in green. The dashed lines indicate in blue the boundary of the region of interest in r where the break may potentially be found and in yellow the break position.
. Bottom Left Panel:IE−HE colour as a function of the semi-major axis r between [rb, rmax]. Bottom Right Panel: Surface brightness profile μHE versus semi-major axis (r) of the fitted ellipses. The solid lines indicate the fitted models after the radius of the bulge: disc model in blue, disc1/disc2 model in green. The dashed lines indicate in blue the boundary of the region of interest in r where the break may potentially be found and in yellow the break position.
Current usage metrics show cumulative count of Article Views (full-text article views including HTML views, PDF and ePub downloads, according to the available data) and Abstracts Views on Vision4Press platform.
Data correspond to usage on the plateform after 2015. The current usage metrics is available 48-96 hours after online publication and is updated daily on week days.
Initial download of the metrics may take a while.