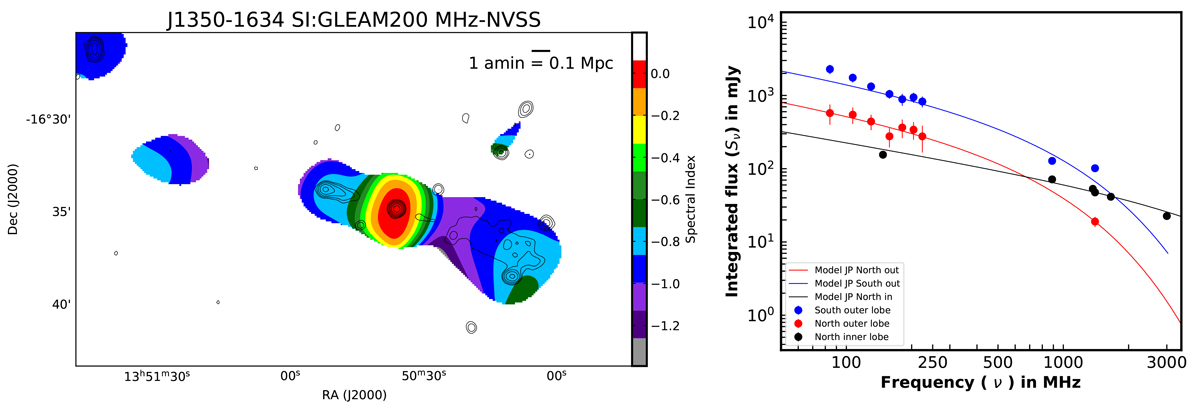
Fig. C.1.
Download original image
The left panel shows the RACS-mid (887 MHz, with rms of 0.3 mJy beam−1) contours on the SI map between 200 MHz GLEAM and the convolved 1400 MHz NVSS maps. The RACS-mid contours are plotted at 3 rms × 2n (n = 0, 1, 2, 3 ...). The right panel shows the radio spectra of both outer lobes (SW and NE) and NE inner of the target source fitted with the JP model with SYNAGE (for details, see Sect. 3.5).
Current usage metrics show cumulative count of Article Views (full-text article views including HTML views, PDF and ePub downloads, according to the available data) and Abstracts Views on Vision4Press platform.
Data correspond to usage on the plateform after 2015. The current usage metrics is available 48-96 hours after online publication and is updated daily on week days.
Initial download of the metrics may take a while.