Fig. 1.
Download original image
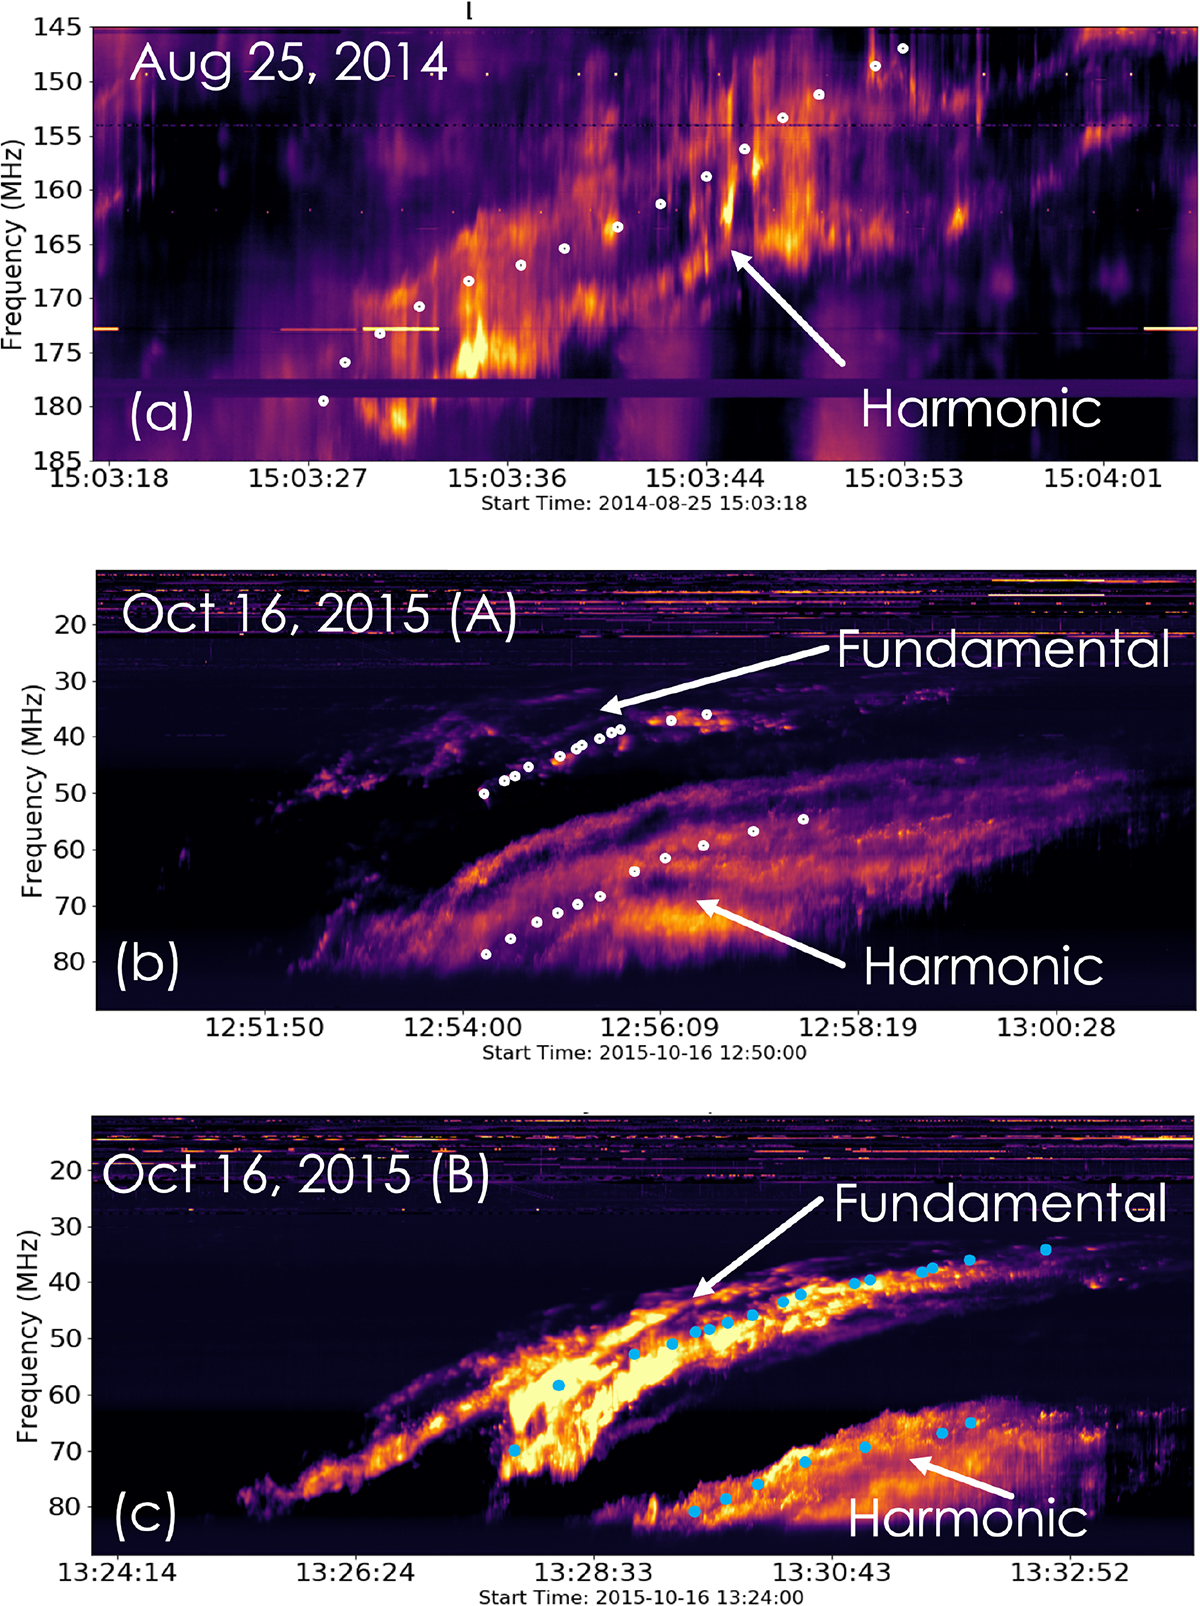
Dynamic spectra of (a) harmonic band of type II burst observed with HBA of LOFAR on August 25, 2014; (b) F-H of type II bursts observed with LBA of LOFAR on October 16, 2015 (A) (the upper part of the spectra (HBA) is not shown here); (c) same as (b), but for October 16, 2015 (B) event. The arrow shows the F-H bands of these type II bursts. The white and cyan marks are the time frequency at which interferometric radio imaging was carried out and are shown in subsequent figures in this article. The imaging time and frequency were chosen in such a way to cover both fundamental and harmonic bands of type II bursts (if available).
Current usage metrics show cumulative count of Article Views (full-text article views including HTML views, PDF and ePub downloads, according to the available data) and Abstracts Views on Vision4Press platform.
Data correspond to usage on the plateform after 2015. The current usage metrics is available 48-96 hours after online publication and is updated daily on week days.
Initial download of the metrics may take a while.