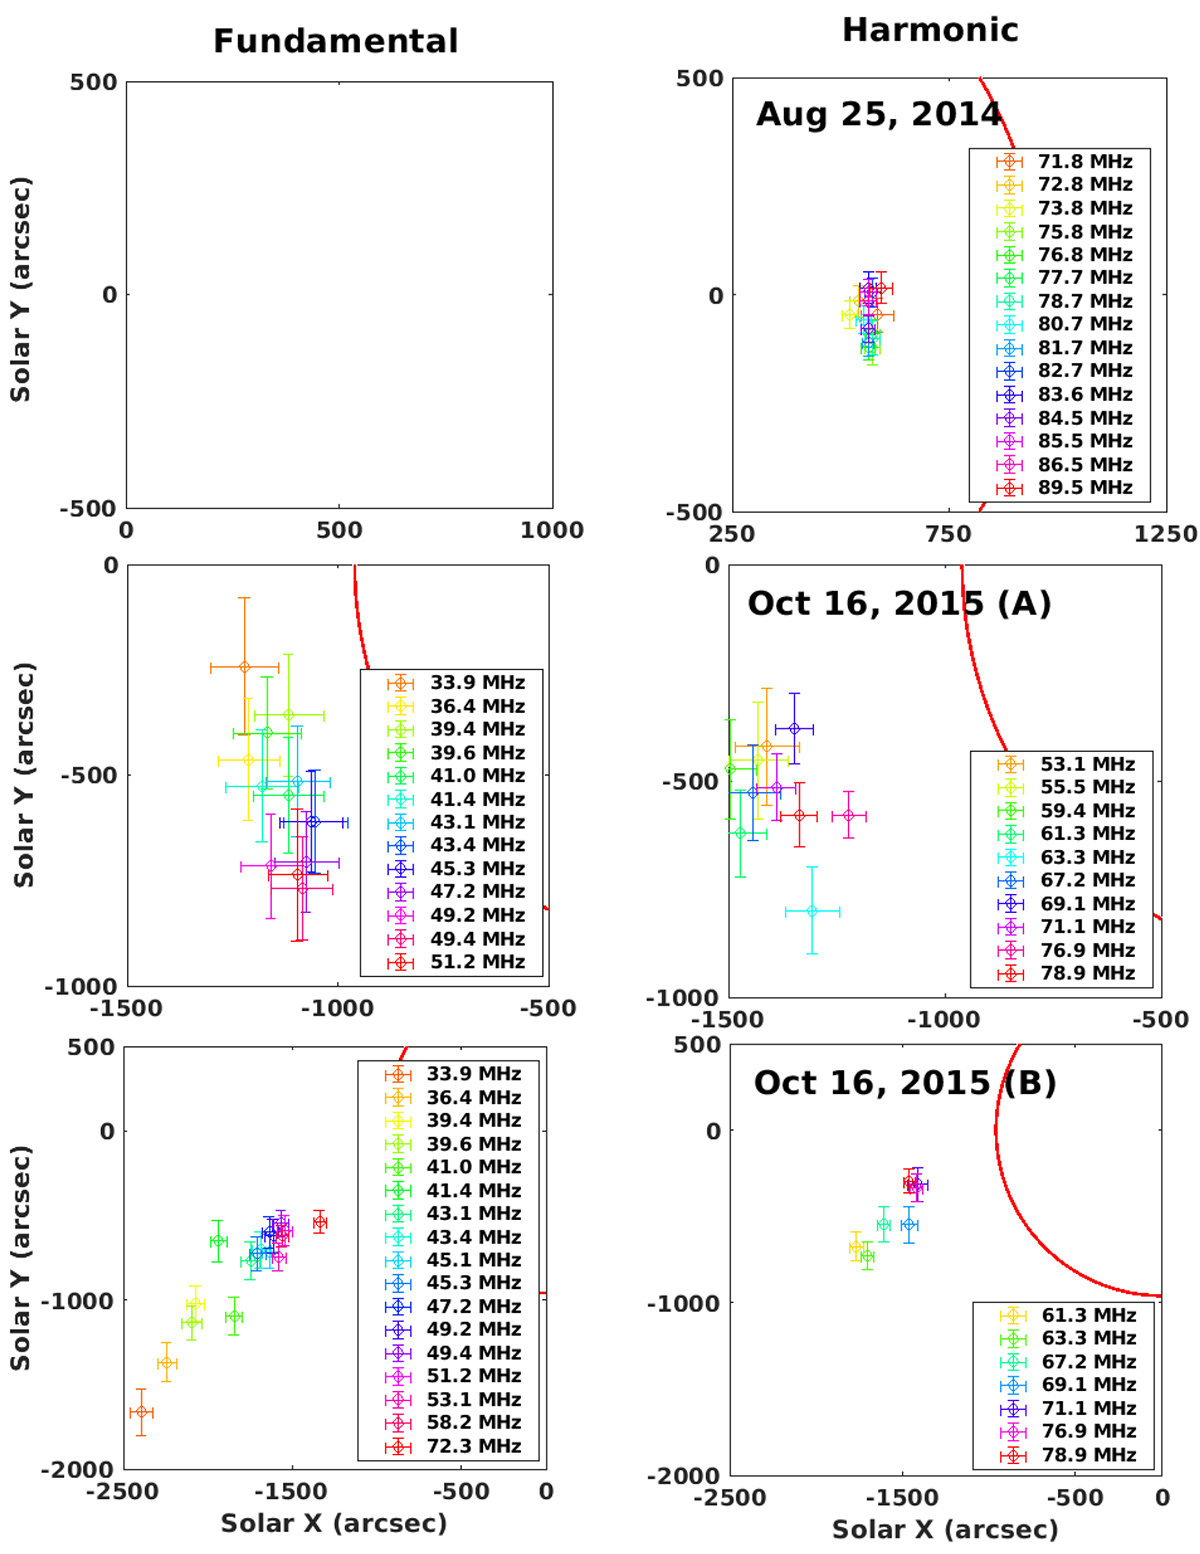
Fig. 2.
Download original image
Centroid location of type II radio burst sources for all the three events studied in the present work (row-wise). The fundamental and harmonic radio sources are plotted column-wise. The extent of these sources in the major and minor directions is represented by the bars centered on each centroid in the x and y directions, respectively. The red circles show the visible Sun. Since there was no interferometric observation for the fundamental band of the first type II, we have images for the harmonic band only. These images correspond to the white and cyan marks on the three spectra shown in Fig. 1.
Current usage metrics show cumulative count of Article Views (full-text article views including HTML views, PDF and ePub downloads, according to the available data) and Abstracts Views on Vision4Press platform.
Data correspond to usage on the plateform after 2015. The current usage metrics is available 48-96 hours after online publication and is updated daily on week days.
Initial download of the metrics may take a while.