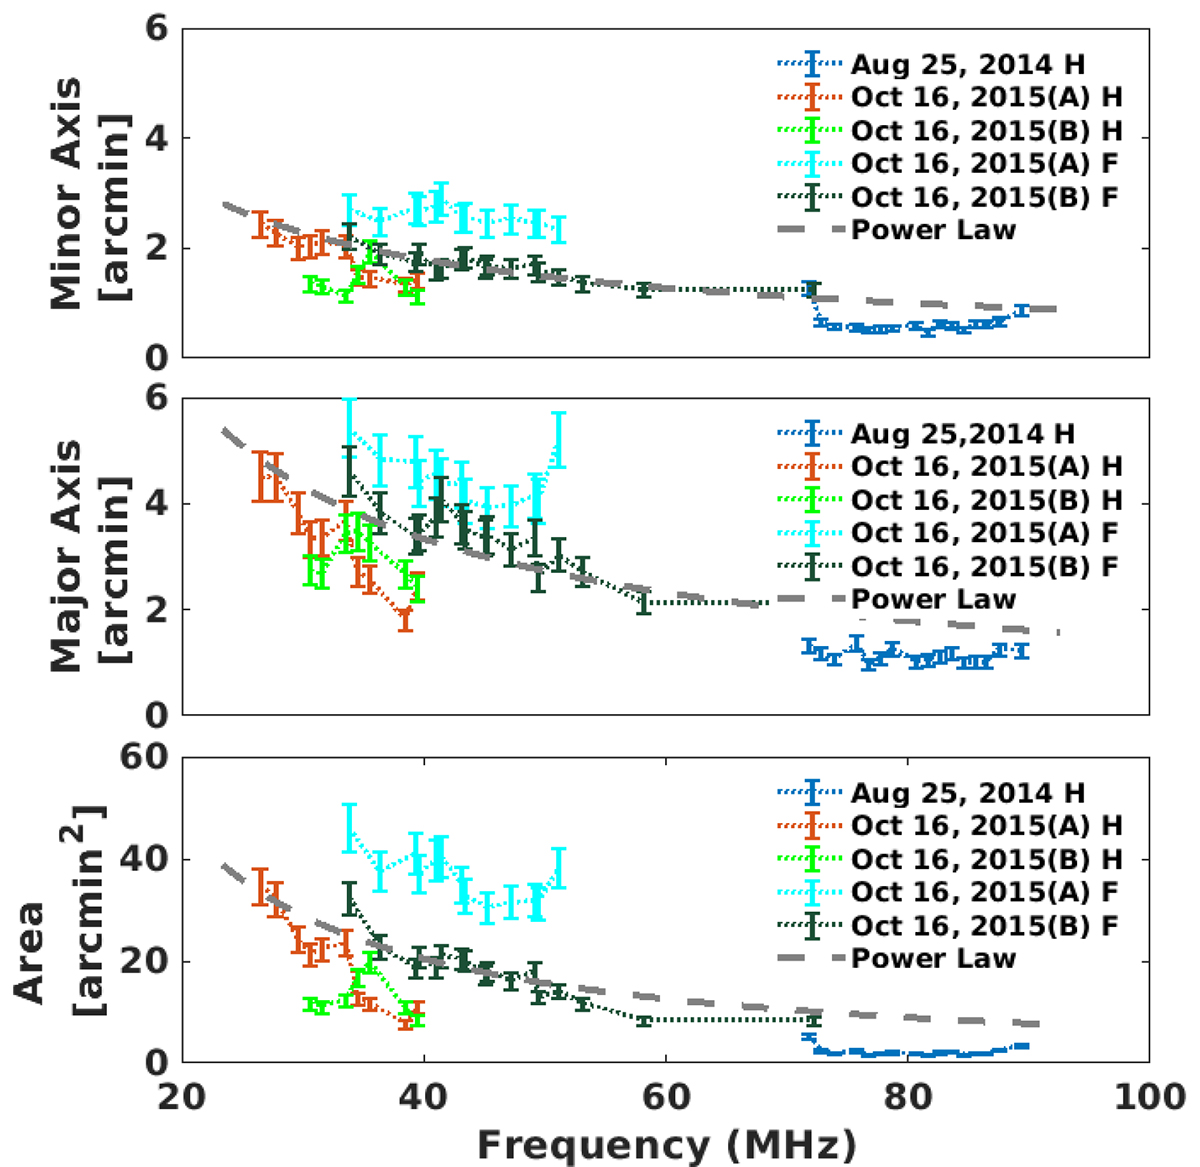
Fig. 3.
Download original image
Sizes (major and minor extent [1/e]) and area of radio sources for all three type II bursts studied in the present work: (a) radio sources extended in equatorial direction; (b) radio sources extended in polar direction; (c) area of the radio sources. Different events and data corresponding to their features are shown in different colors. The grey dashed line is a combined power-law fit to the data. The error bars denote the uncertainty in source sizes following the Gaussian fit to the radio sources to estimate their sizes.
Current usage metrics show cumulative count of Article Views (full-text article views including HTML views, PDF and ePub downloads, according to the available data) and Abstracts Views on Vision4Press platform.
Data correspond to usage on the plateform after 2015. The current usage metrics is available 48-96 hours after online publication and is updated daily on week days.
Initial download of the metrics may take a while.