Open Access
Fig. A.2.
Download original image
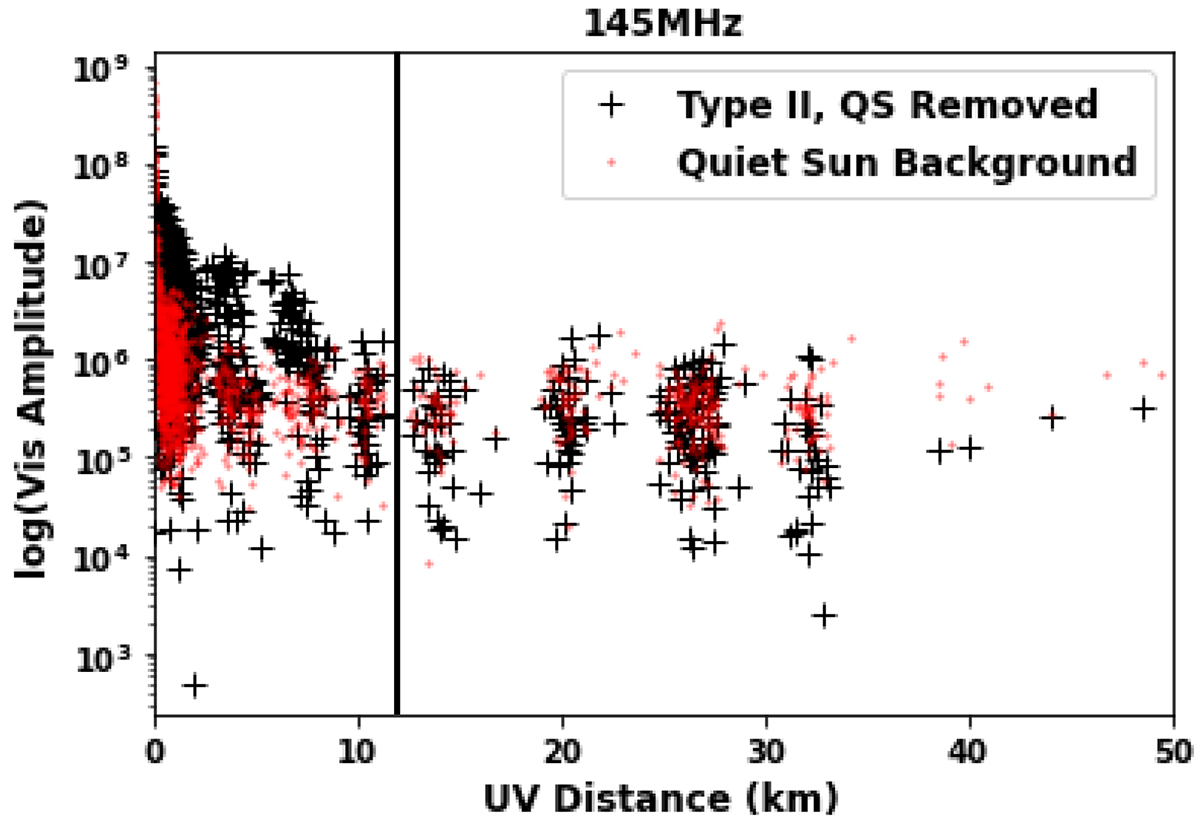
Visibility amplitudes versus UV distance for type II bursts (black) and quiet Sun images (red). Here, the quiet Sun is averaged over 2 minutes to enhance the contrast. After the black curve flattens, the excess flux arises from increased noise due to the shorter (20-second) integration during the burst.
Current usage metrics show cumulative count of Article Views (full-text article views including HTML views, PDF and ePub downloads, according to the available data) and Abstracts Views on Vision4Press platform.
Data correspond to usage on the plateform after 2015. The current usage metrics is available 48-96 hours after online publication and is updated daily on week days.
Initial download of the metrics may take a while.