Fig. 1.

Download original image
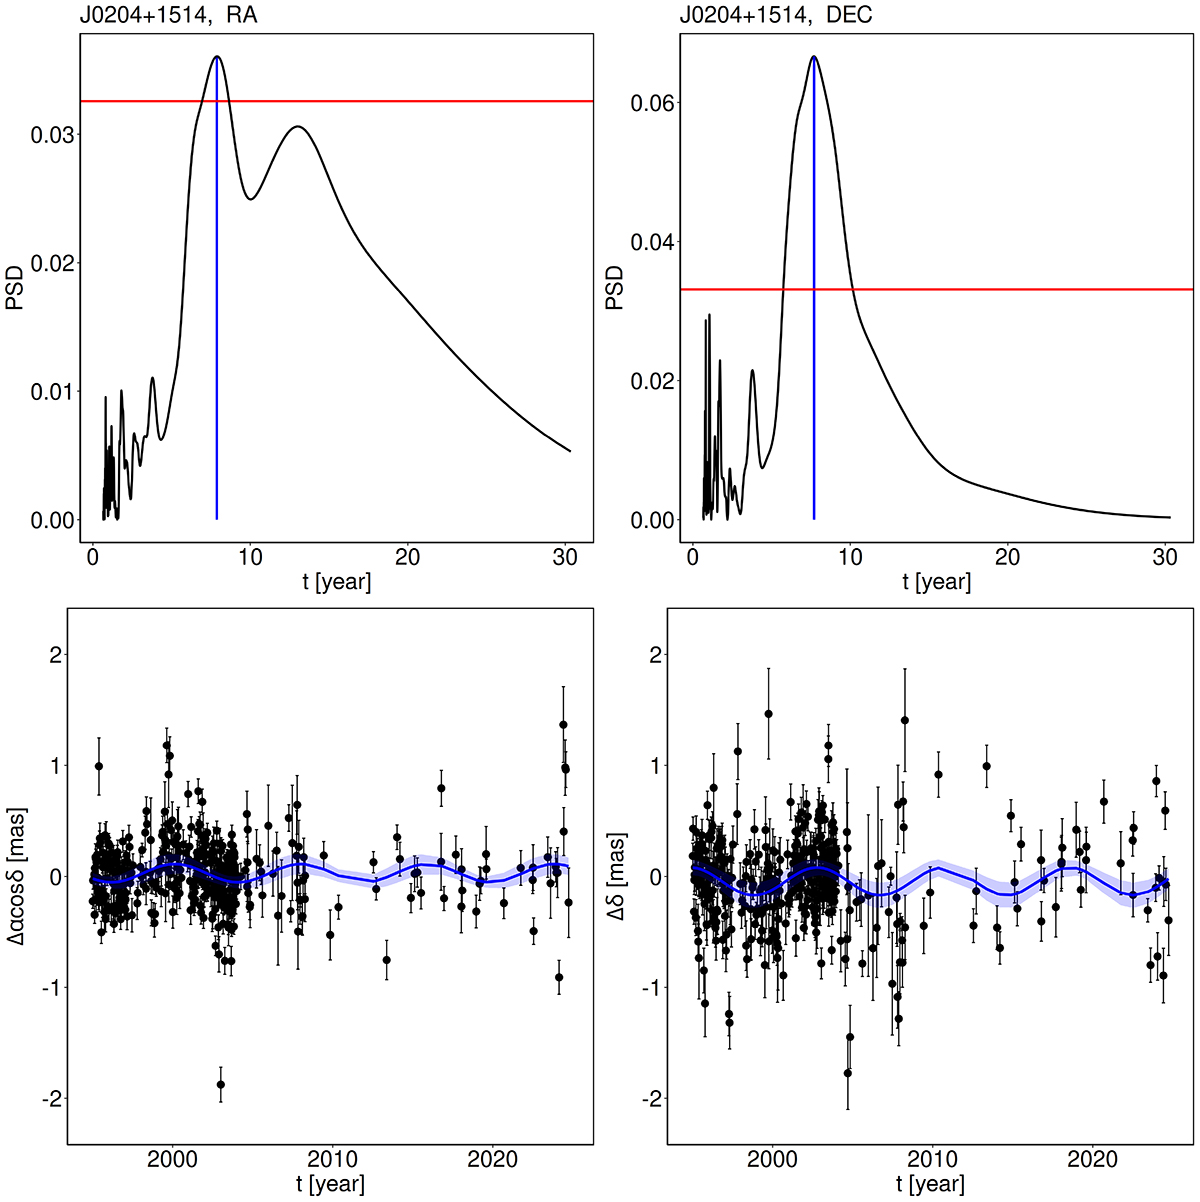
Top plots: GLS spectra of RA (left) and Dec (right) of VLBI astrometry measurements of the source J0204+1415 over nearly 30 years. The vertical blue lines indicate the peak (maximum) period value of 7.9 years in both co-ordinates. The horizontal red line marks the level below which the FAP (false alarm probability) is higher than 5% (VanderPlas 2018). Bottom plots: Temporal variations of RA (left) and Dec (right) of VLBI astrometric measurements centred to the J2000.0 position RA = 02h04min50.4138s and Dec = +15° 14′ 11.043″ (Xu et al. 2019). The trend with coefficients from Table 1 has been removed. The observational data points are shown in black with their formal ±1σ error bars. An apparent decrease in data time density after ∼2009 is due to the recognised anomalous astrometric behaviour and exclusion of the source from regular IVS observing runs (see Section 2 for explanation and reference). The blue curves represent the model fit with parameters listed in Table 1. The shaded blue area around the blue curves indicates the 99.73% confidence interval (±3σ) for the model prediction.
Current usage metrics show cumulative count of Article Views (full-text article views including HTML views, PDF and ePub downloads, according to the available data) and Abstracts Views on Vision4Press platform.
Data correspond to usage on the plateform after 2015. The current usage metrics is available 48-96 hours after online publication and is updated daily on week days.
Initial download of the metrics may take a while.


