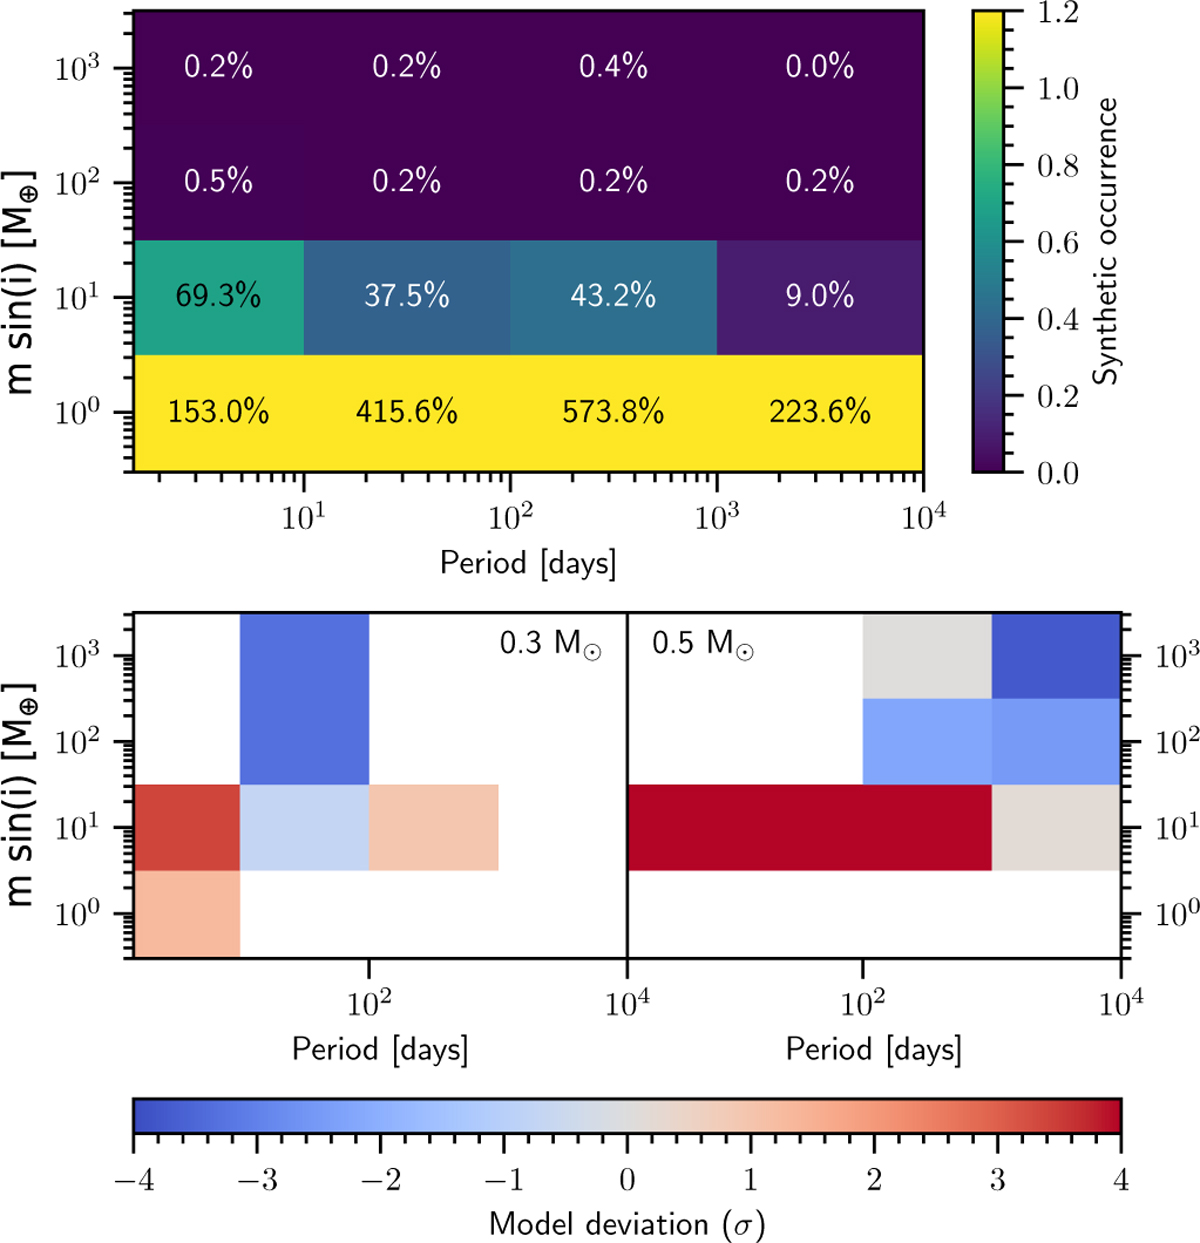
Fig. 10
Download original image
Occurrence rates of theoretically calculated planets by Burn et al. (2021). The same bins as in Figs. 3, 4, and 5 are used. Values of sin i are randomly assigned to the synthetic systems following the expected distribution for randomly oriented systems (Schlecker et al. 2022). The top panel shows the synthetic occurrence for the combined discrete stellar masses of 0.3 M⊙ and 0.5 M⊙. The bottom panels show the deviation from observations measured in standard deviations (fp,synthetic – fp)/Sfp for the indicated stellar masses compared to the observational data from Figs. 5 (left) and 4 (right). Where observational upper limits are in agreement with theory, the box is left blank.
Current usage metrics show cumulative count of Article Views (full-text article views including HTML views, PDF and ePub downloads, according to the available data) and Abstracts Views on Vision4Press platform.
Data correspond to usage on the plateform after 2015. The current usage metrics is available 48-96 hours after online publication and is updated daily on week days.
Initial download of the metrics may take a while.