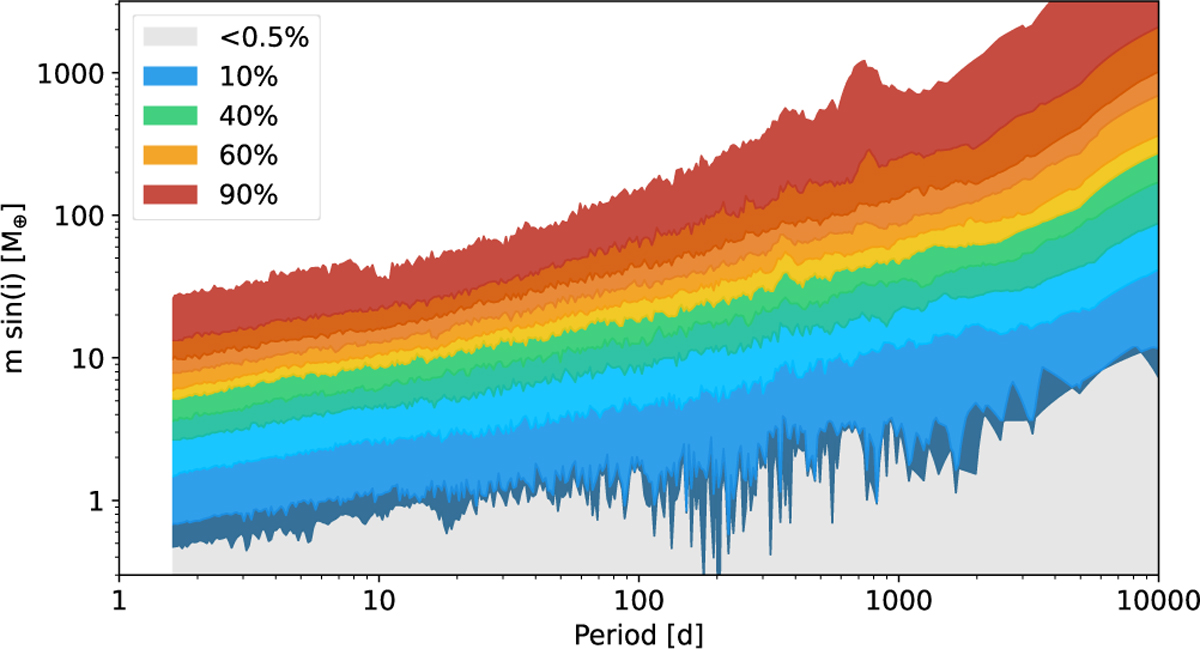
Fig. 2
Download original image
Iso-frequency map obtained by stacking the 197 statistical detection limits in projected masses as a function of the period. Iso-contours are highlighted for several percentage levels of the sample and describe the distribution of maximum mass missed. The grey part represents the unknown domain, below the lowest statistical detection limit (corresponding to 0.5%), and the white part is the domain beyond 100%.
Current usage metrics show cumulative count of Article Views (full-text article views including HTML views, PDF and ePub downloads, according to the available data) and Abstracts Views on Vision4Press platform.
Data correspond to usage on the plateform after 2015. The current usage metrics is available 48-96 hours after online publication and is updated daily on week days.
Initial download of the metrics may take a while.