Fig. 3
Download original image
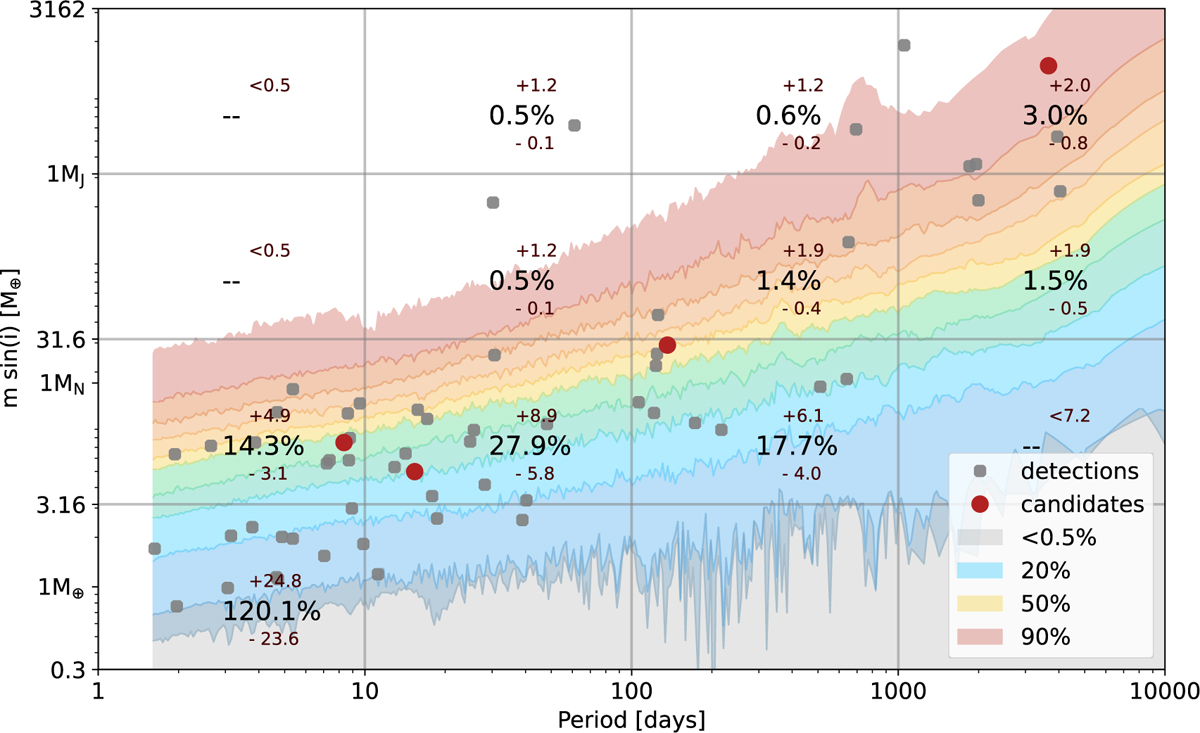
Planetary occurrence statistic. Colours in the background refer to the detection limit map, from the non-reachable region (grey) to the unmissable one (white). The grey points represent the considered detections, while the red points represent the candidates. The grey horizontal and vertical lines delineate the probed domains. The computed occurrence rates (along with their corresponding statistical bounds) are indicated at the centre of each domain.
Current usage metrics show cumulative count of Article Views (full-text article views including HTML views, PDF and ePub downloads, according to the available data) and Abstracts Views on Vision4Press platform.
Data correspond to usage on the plateform after 2015. The current usage metrics is available 48-96 hours after online publication and is updated daily on week days.
Initial download of the metrics may take a while.