Open Access
Fig. 7
Download original image
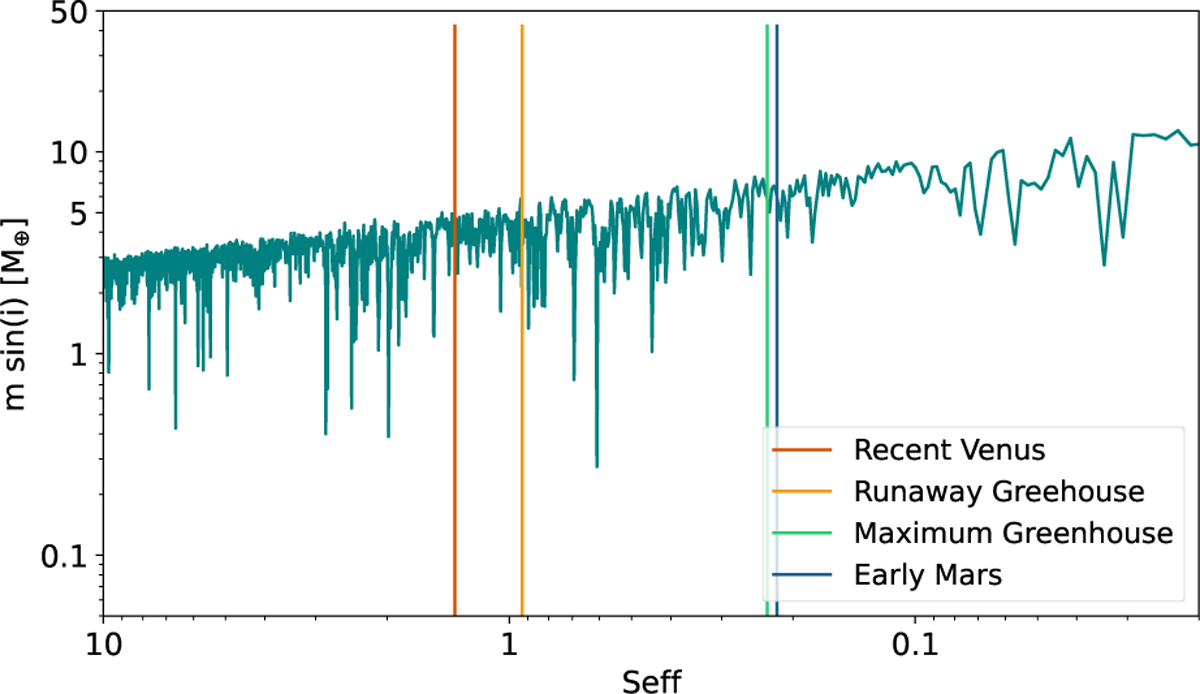
GJ 163 statistical mass limit as function of insolation. The vertical bars represent the inner (orange: recent Venus; yellow: runaway greenhouse) and outer (green: maximum greenhouse; blue: early Mars) boundaries of the HZ defined in Kopparapu et al. (2013).
Current usage metrics show cumulative count of Article Views (full-text article views including HTML views, PDF and ePub downloads, according to the available data) and Abstracts Views on Vision4Press platform.
Data correspond to usage on the plateform after 2015. The current usage metrics is available 48-96 hours after online publication and is updated daily on week days.
Initial download of the metrics may take a while.