Fig. 11
Download original image
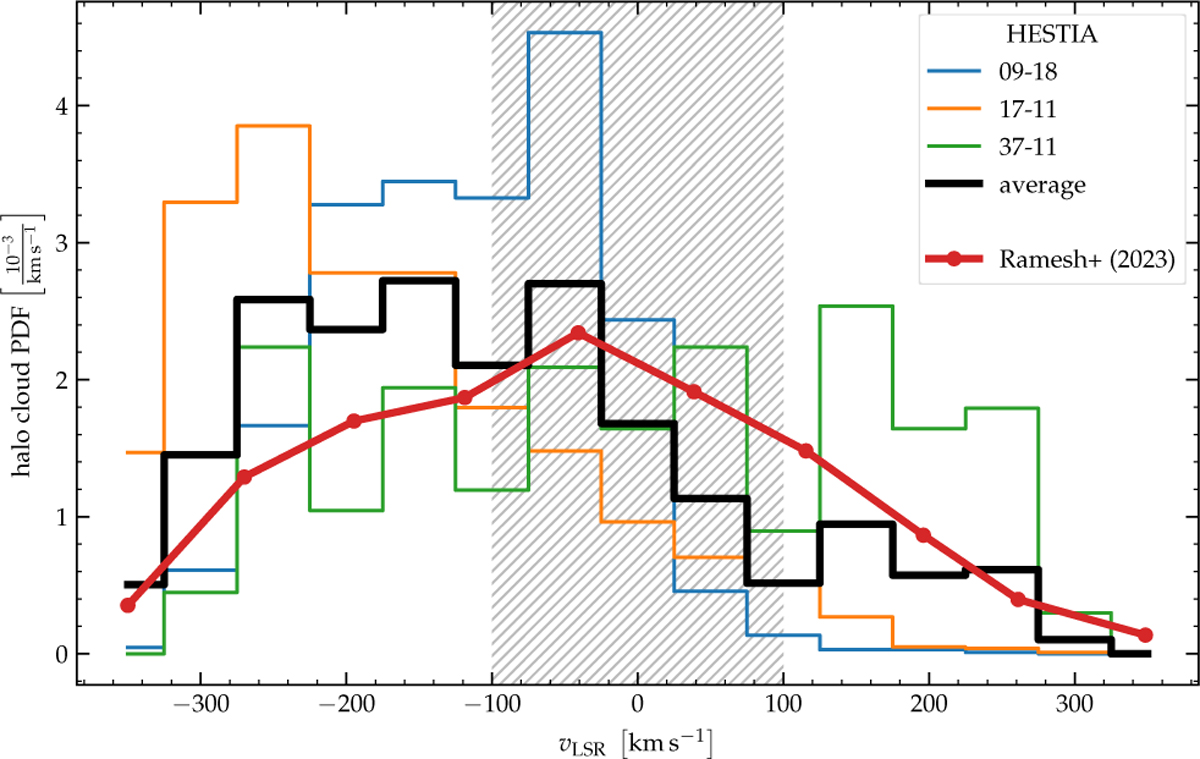
Halo cloud radial velocity statistics given as a probability distribution. The colored graphs show the distributions for the three simulations individually as well as their average in black. The red line shows the result from Ramesh et al. (2023), who conducted a similar analysis based on 132 Milky Way-like halos from the TNG50 simulation. For a description of their galaxy sample we refer to Sect. 4.3. The hatched area highlights the low-velocity region with |vLSR| ≤ 100 km s−1. The histogram is binned into bins with a width of 50 km s−1.
Current usage metrics show cumulative count of Article Views (full-text article views including HTML views, PDF and ePub downloads, according to the available data) and Abstracts Views on Vision4Press platform.
Data correspond to usage on the plateform after 2015. The current usage metrics is available 48-96 hours after online publication and is updated daily on week days.
Initial download of the metrics may take a while.