Open Access
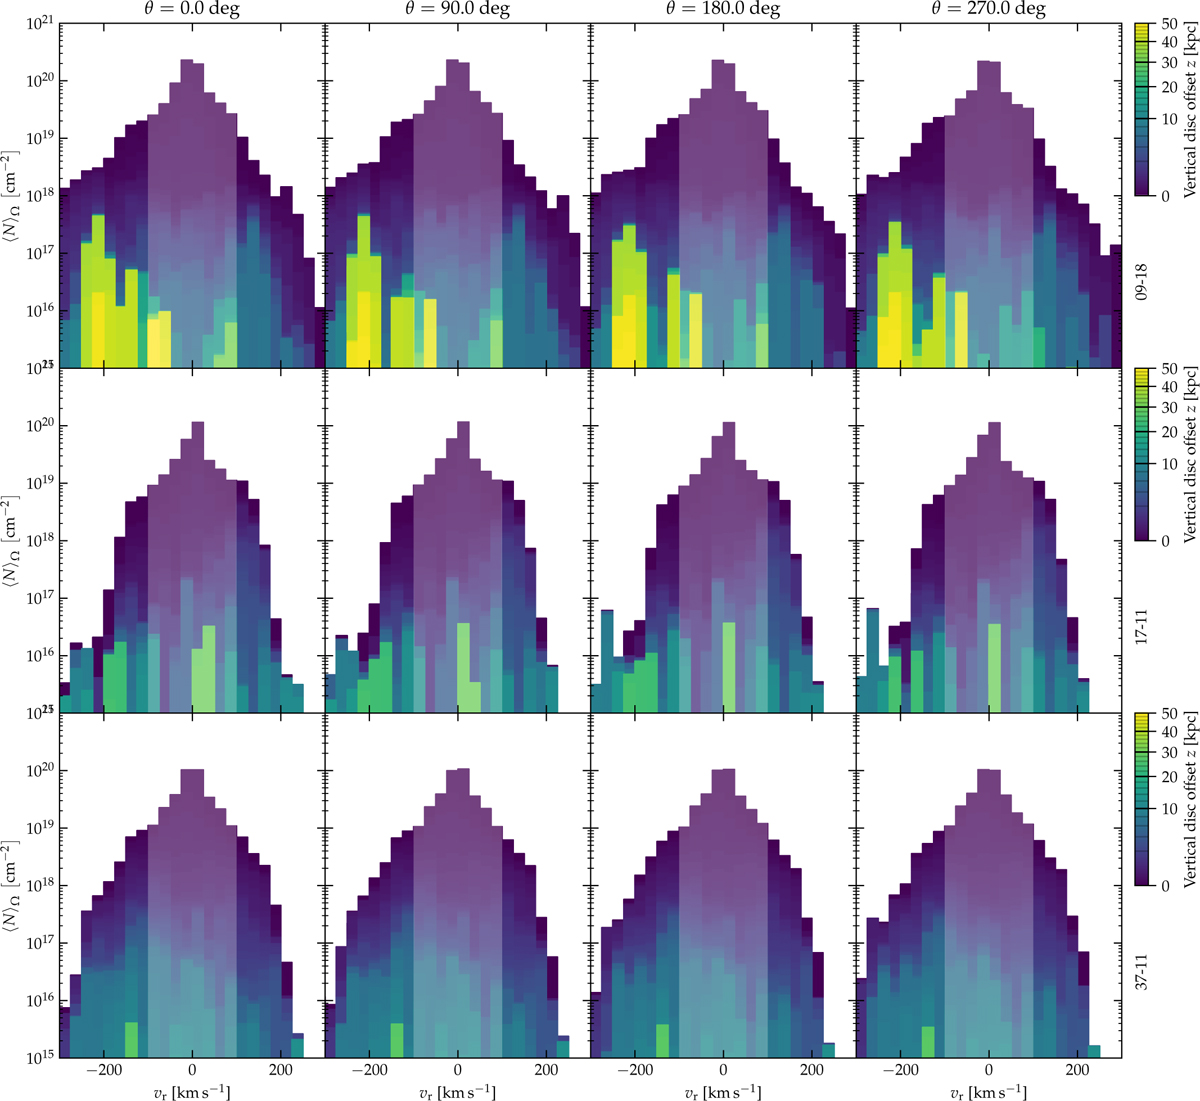
Fig. A.1
Download original image
Similar to Fig. 3 but with different distinct azimuth angles along the solar circle as indicated at the top of each column. Each row refers to the respective simulation run as indicated on the right. The color-coding of vertical distances is the same in all panels.
Current usage metrics show cumulative count of Article Views (full-text article views including HTML views, PDF and ePub downloads, according to the available data) and Abstracts Views on Vision4Press platform.
Data correspond to usage on the plateform after 2015. The current usage metrics is available 48-96 hours after online publication and is updated daily on week days.
Initial download of the metrics may take a while.