Fig. 2
Download original image
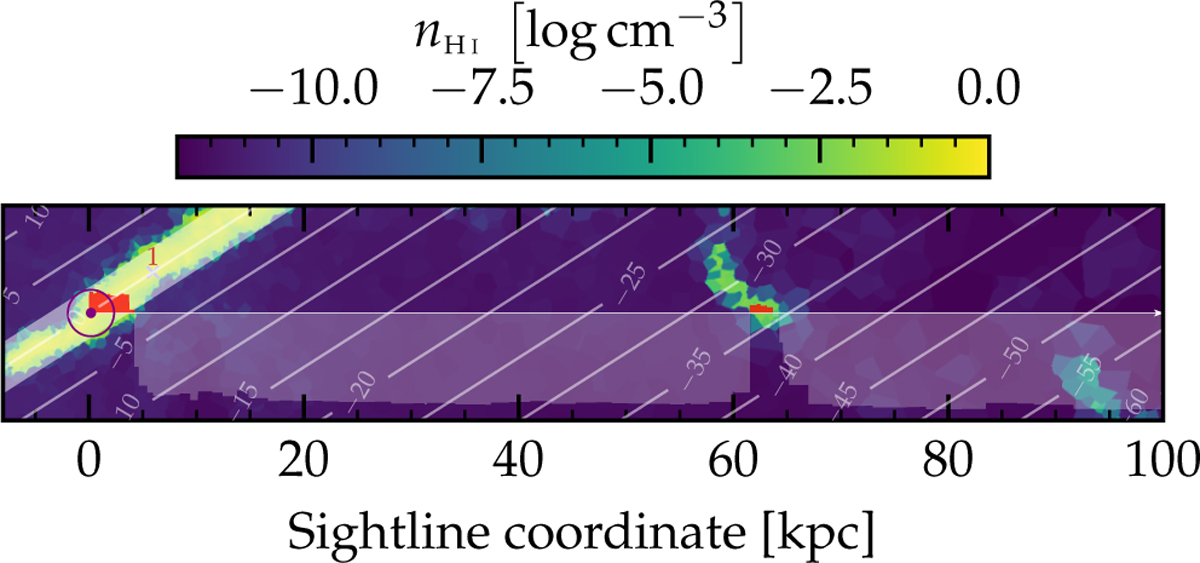
Immediate vicinity of an arbitrary sightline. At a sightline coordinate of ~60 kpc we can see how the sightline traverses a halo cloud identified as the overdensity that surpasses the threshold density (log n/cm−3 ~ −3 in this case) of H I gas. The overall logarithmic gas density is drawn as the transparent white and solid red-filled curve along the sightline. Wherever the gas density exceeds the threshold density it is shown as a red region above the sightline arrow, thus constituting a halo cloud. The Galactic disk as well as the LSR locus can be seen on the left and are indicated as such. The subhalo number of the galaxy is displayed. The diagonal grid illustrates the vertical Galactic disk offsets in steps of 5 kpc, pinpointing the cloud’s position in this example to an altitude of roughly 30 kpc.
Current usage metrics show cumulative count of Article Views (full-text article views including HTML views, PDF and ePub downloads, according to the available data) and Abstracts Views on Vision4Press platform.
Data correspond to usage on the plateform after 2015. The current usage metrics is available 48-96 hours after online publication and is updated daily on week days.
Initial download of the metrics may take a while.