Fig. 3
Download original image
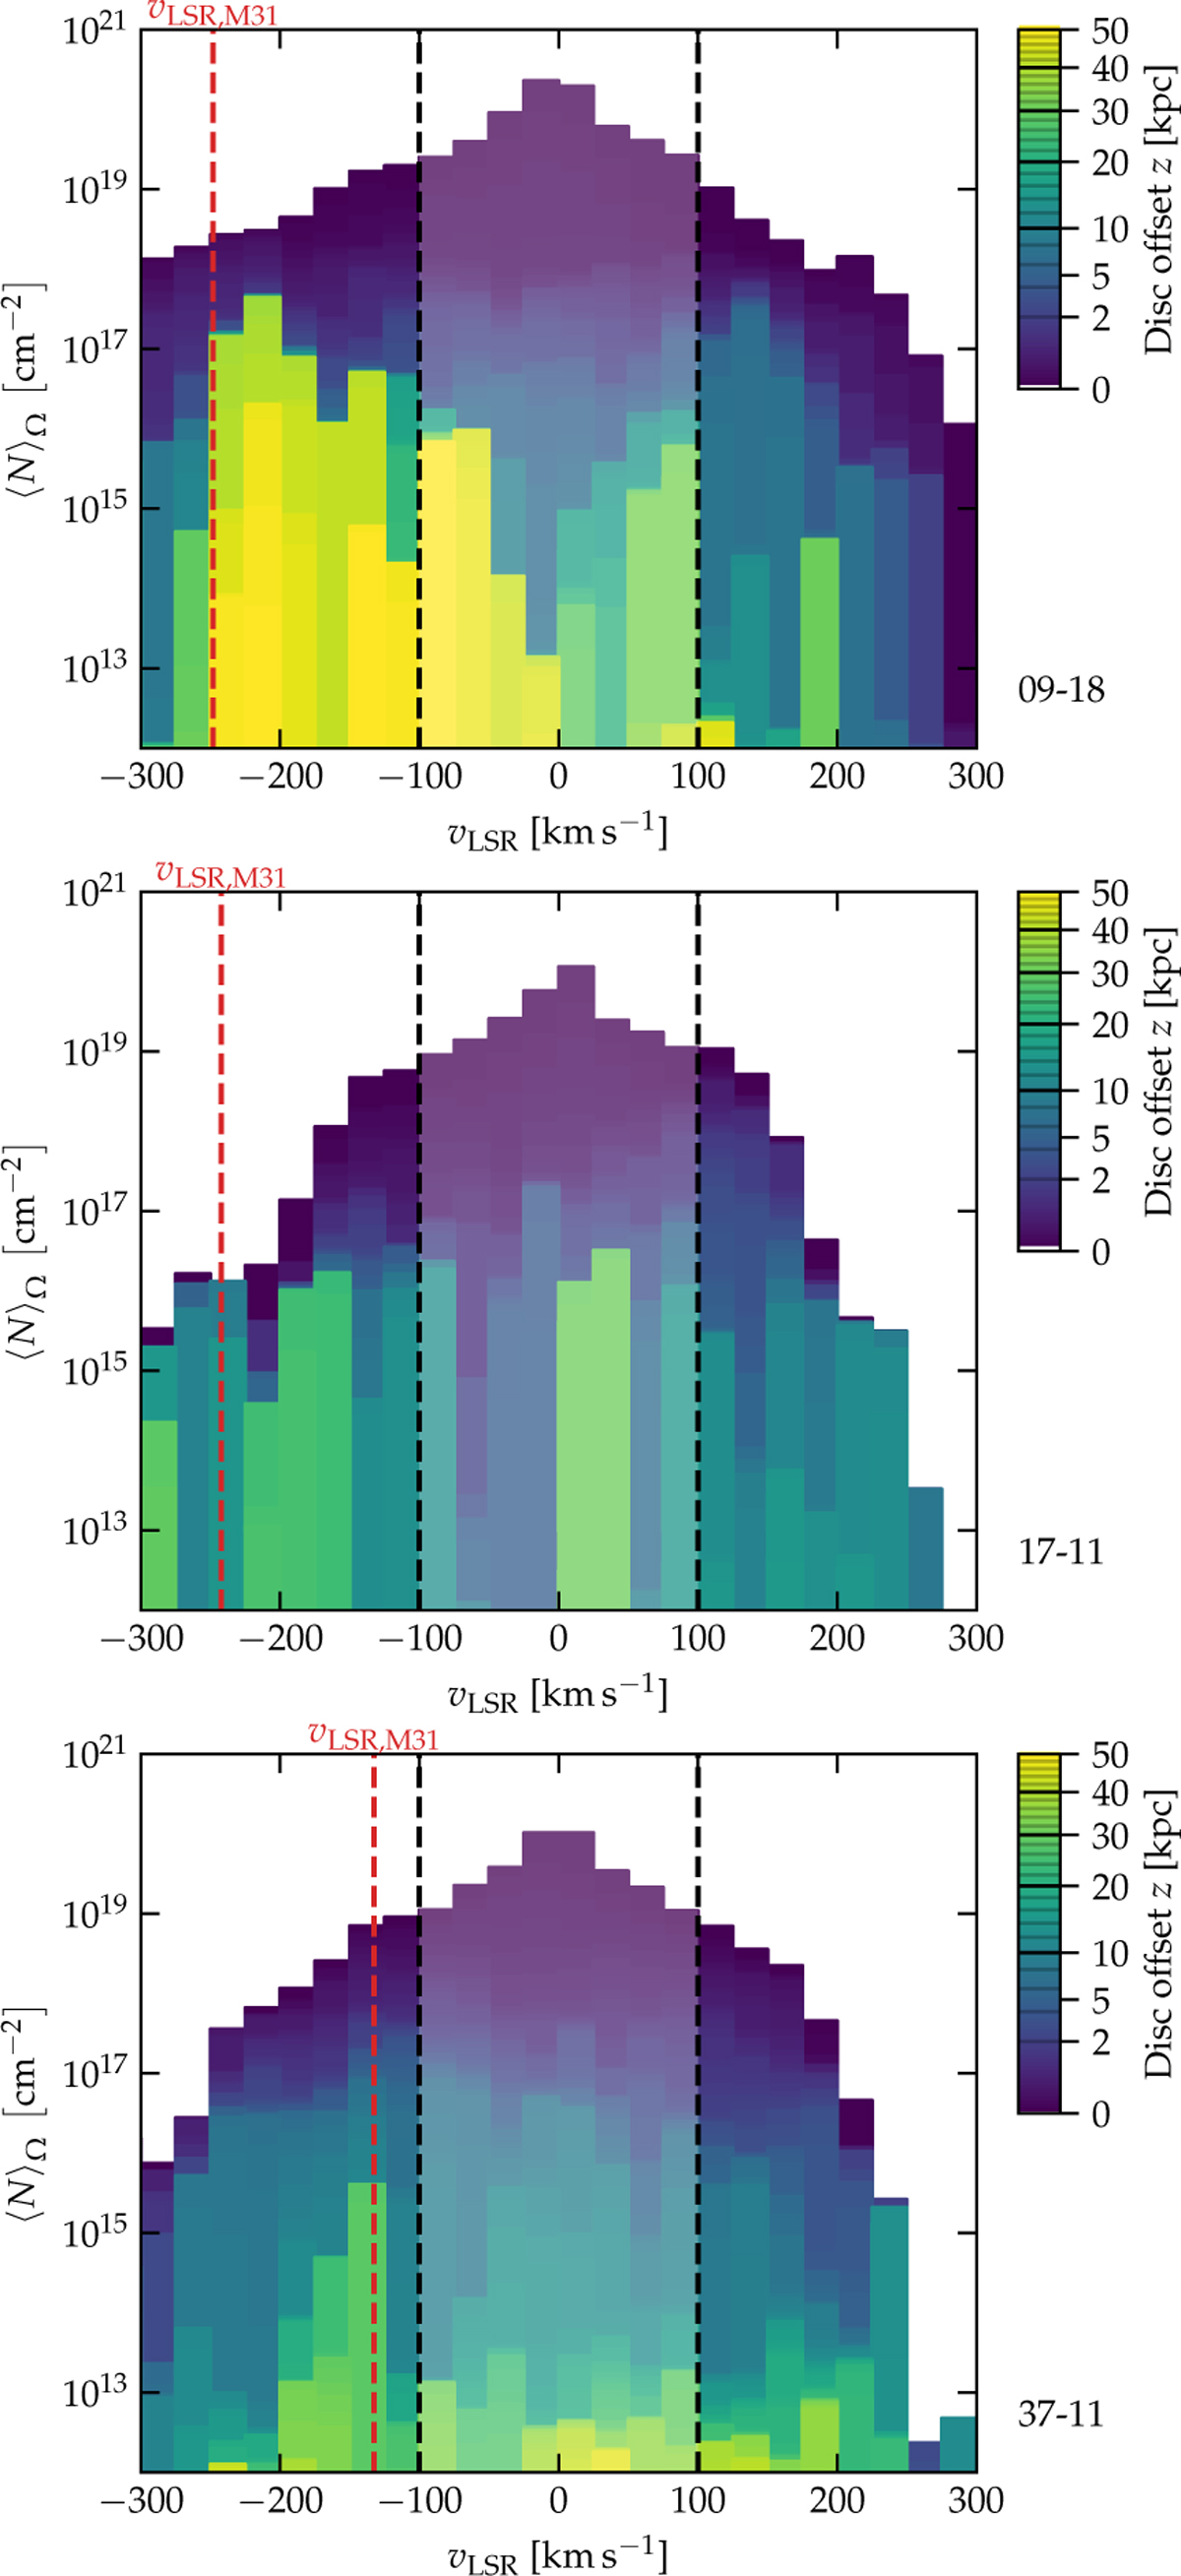
Column density-weighted radial velocity distribution of the neutral hydrogen gas. Each of the plots refers to one of the high-resolution simulation runs from the HESTIA project. Only gas located outside the zone of avoidance, |b| > 30 deg, is considered here. The column densities displayed here represent those that are averaged over the entire unit sphere excluding the zone of avoidance. Each velocity bin has a width of 25 km s−1. The vertical disk position, z, of the gas is color-coded (see color bars at the right). The shaded central region indicates the low-velocity regime with vLSR < 100 km s−1. The red dashed line indicated the radial velocity of M31 in the local standard of rest reference frame. It is important to note that these velocities refer to the recession velocities encountered in the respective simulation and why they are found at different values in each simulation.
Current usage metrics show cumulative count of Article Views (full-text article views including HTML views, PDF and ePub downloads, according to the available data) and Abstracts Views on Vision4Press platform.
Data correspond to usage on the plateform after 2015. The current usage metrics is available 48-96 hours after online publication and is updated daily on week days.
Initial download of the metrics may take a while.