Open Access
Fig. 5
Download original image
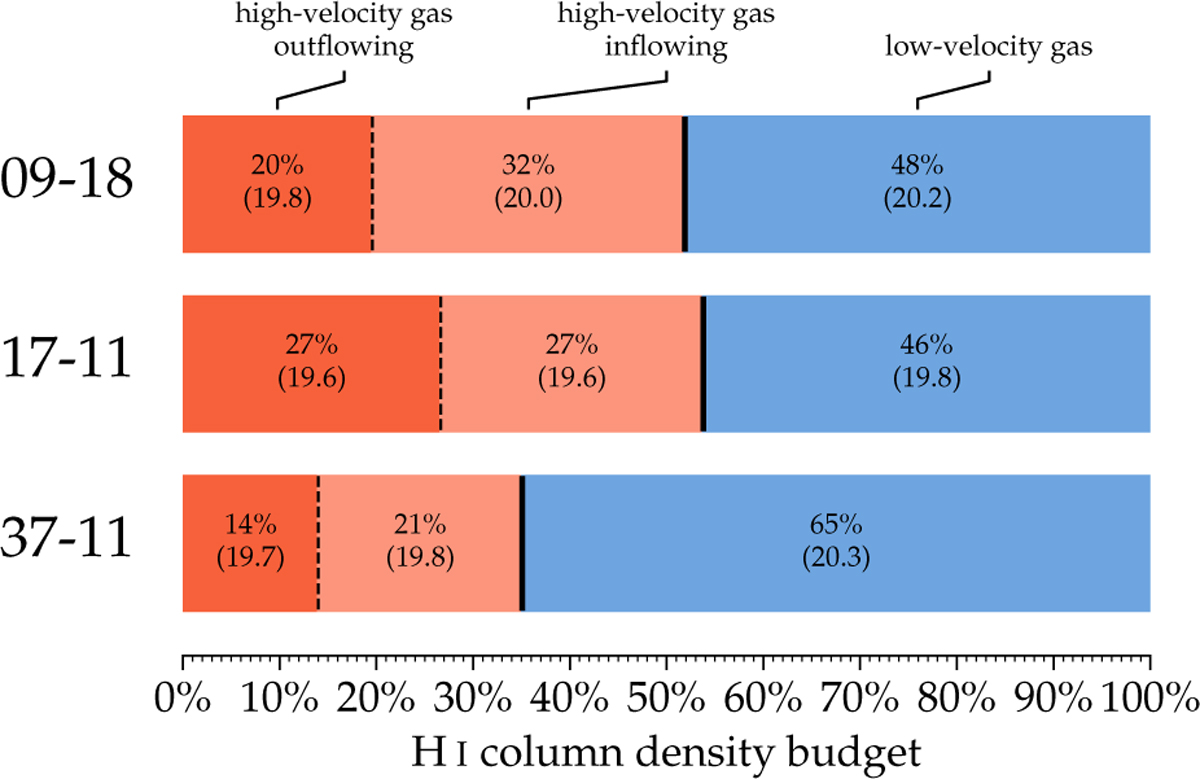
Total H I budgets for gas in the high- and low-velocity regimes. Each bar represents one simulation for which we show the percentages of the respective gas reservoirs. In addition, we list the average column densities per sightline in parentheses expressed in log-units of cm−2.
Current usage metrics show cumulative count of Article Views (full-text article views including HTML views, PDF and ePub downloads, according to the available data) and Abstracts Views on Vision4Press platform.
Data correspond to usage on the plateform after 2015. The current usage metrics is available 48-96 hours after online publication and is updated daily on week days.
Initial download of the metrics may take a while.