Fig. 6
Download original image
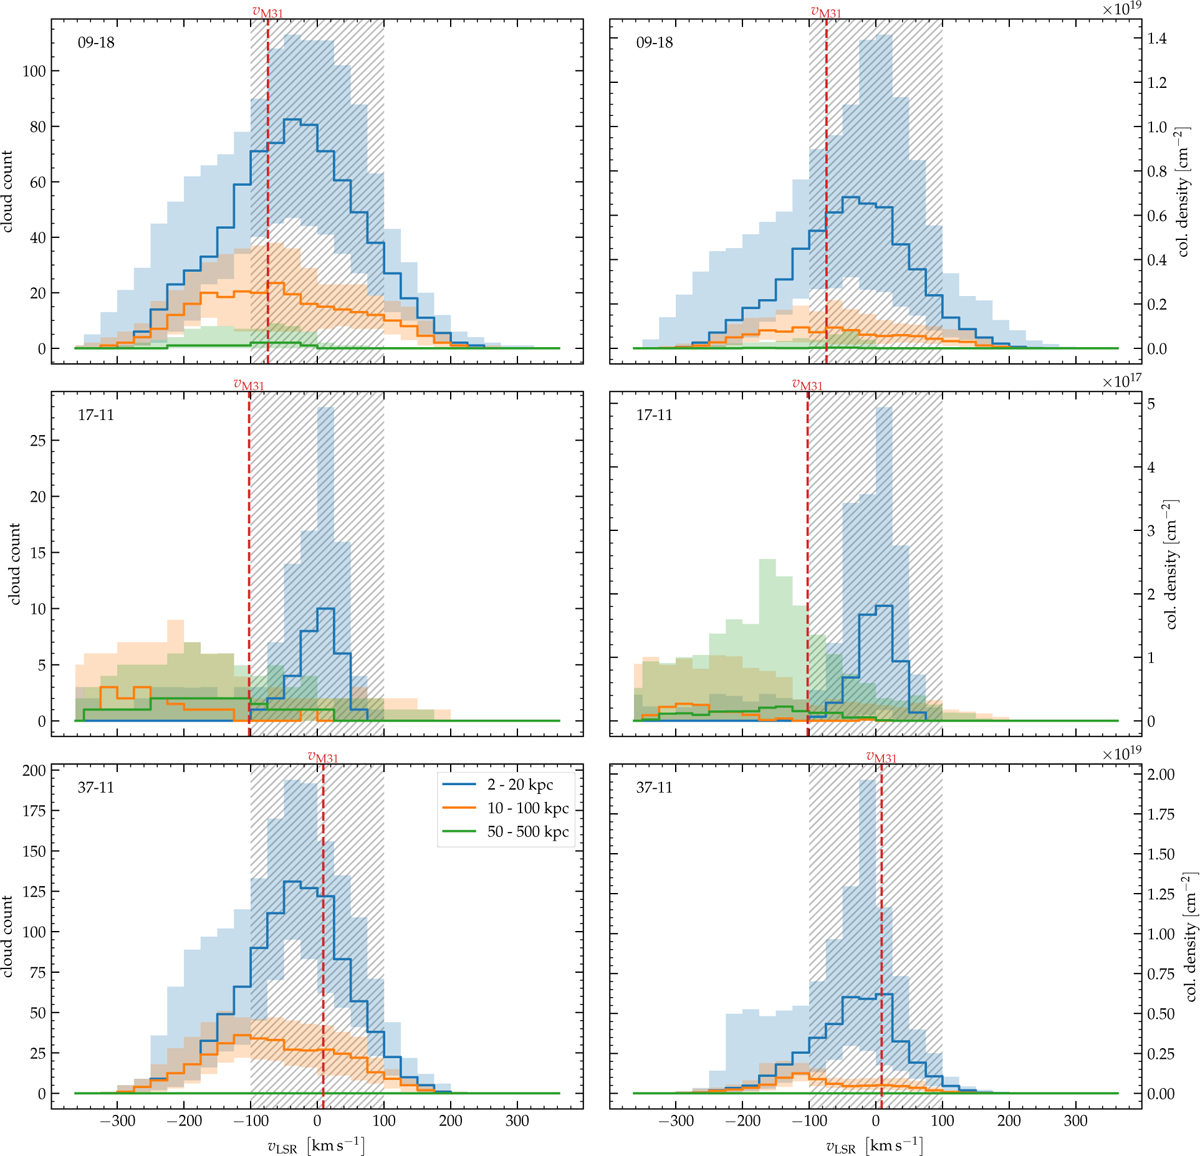
Distribution of halo clouds found using the sightline analysis described in Sect. 2.3. We distinguish the clouds in three distinct vertical disk offset bins: Disk-associated gas (2 kpc < z < 20 kpc); the inner halo and CGM (10 kpc < z < 100 kpc); and a bin that accounts for the rather remote halo regions of the Galaxy (50 kpc < z < 500 kpc), reaching into the Local Group’s intragroup medium. In the left column the absolute cloud counts for the respective velocity bins are drawn. In the right column each detection is weighted with its respective column density. The comparison of the two columns allows an estimate of the average column density per cloud for the individual distance and velocity bins. The shaded regions display the 16th–84th percentile (as compared to the 1σ interval for a Gaussian distribution). The uncertainties stem from repeating the experiment 100 times sampled at different LSR references along the solar circle. The red dashed lines indicate the radial velocity of M31 in each simulation. The light gray hatched region indicates the low-velocity regime where |vLSR| ≤ 100 km s−1. If compared to Fig. 3 it is noteworthy that the red lines for the M31 recession velocities are given here in the Galactic standard of rest. Hence, on average, they are shifted by ~150 km s−1 toward higher values.
Current usage metrics show cumulative count of Article Views (full-text article views including HTML views, PDF and ePub downloads, according to the available data) and Abstracts Views on Vision4Press platform.
Data correspond to usage on the plateform after 2015. The current usage metrics is available 48-96 hours after online publication and is updated daily on week days.
Initial download of the metrics may take a while.