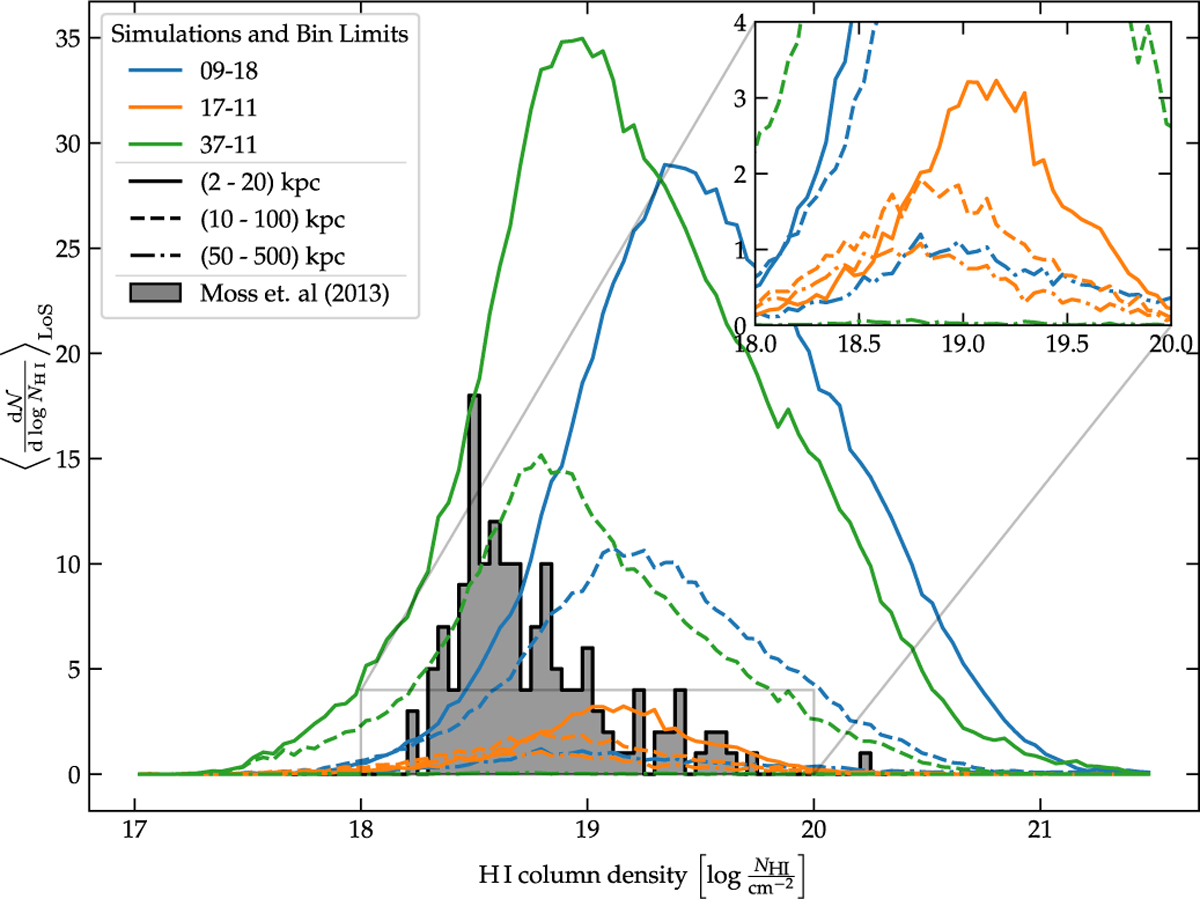
Fig. 7
Download original image
Distribution of high-velocity halo clouds for the three high-resolution simulation runs. The different colors refer to the individual simulation runs and the line style encodes the considered distance bin. The cloud statistics have been sampled in 180 individual reference points along an artificial solar circle in the respective simulation. Each line represents the cloud column density distribution, representing the average of the all-sky mock surveys as seen from the various references along the solar circle. Alongside the simulation data, observational results Moss et al. (2013) are shown. In this representation, we compare the observational findings of Moss et al. (2013). A zoomed-in version of the plot emphasizes the lower abundance regime of the plot, which is particularly populated by the data from the outermost distance bins.
Current usage metrics show cumulative count of Article Views (full-text article views including HTML views, PDF and ePub downloads, according to the available data) and Abstracts Views on Vision4Press platform.
Data correspond to usage on the plateform after 2015. The current usage metrics is available 48-96 hours after online publication and is updated daily on week days.
Initial download of the metrics may take a while.