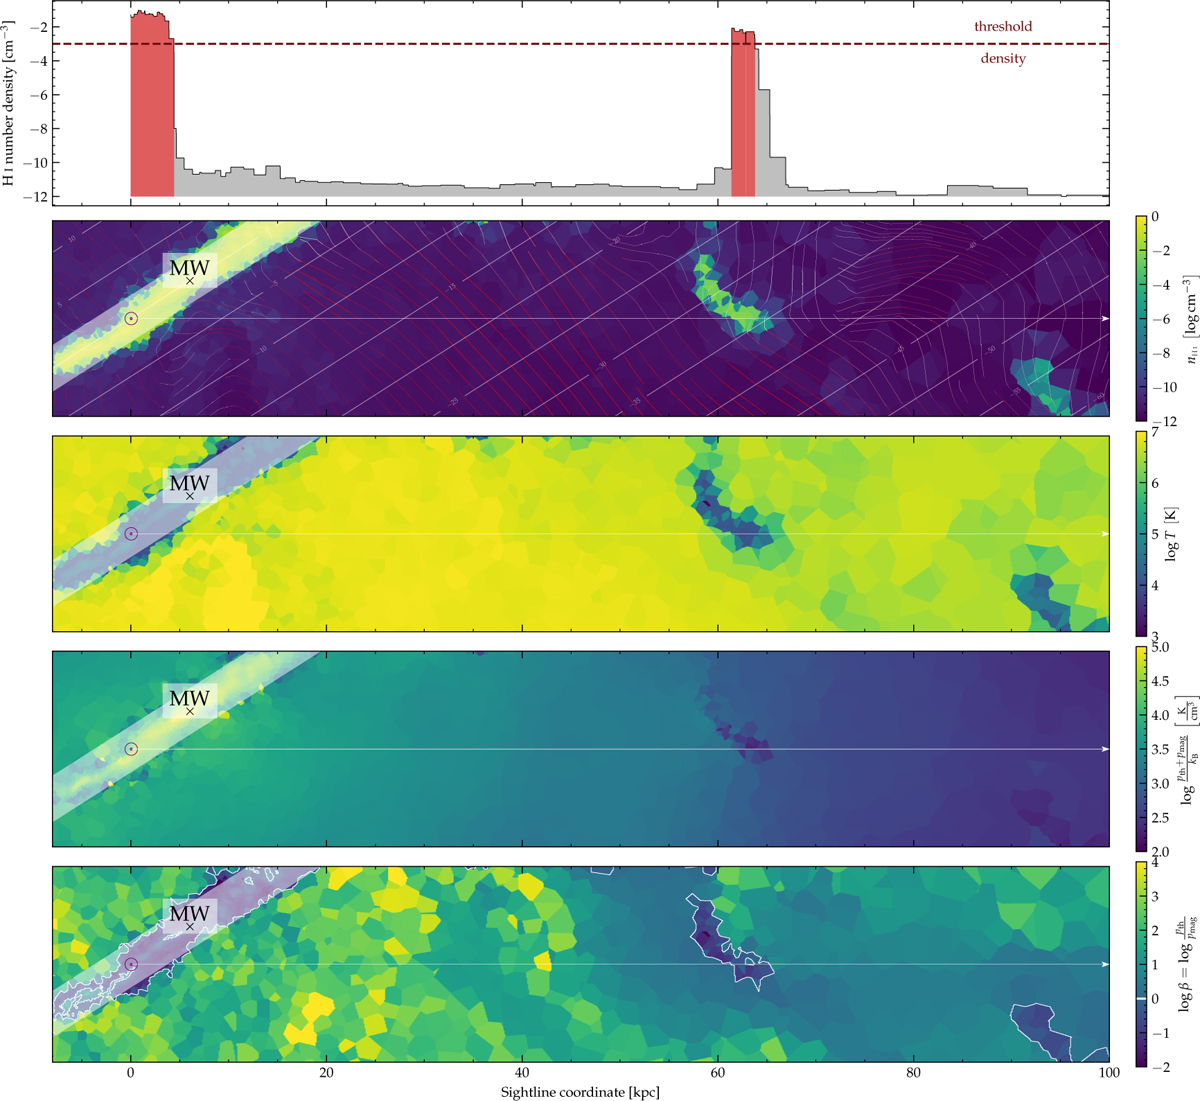
Fig. 8
Download original image
Sightline probing a cloud at a distance of 60 kpc from the mock observer located in the Milky Way. This cloud is not associated with a satellite galaxy; it is a Milky Way halo cloud. We show the H I number density along the sightline (upper panel) and 2D slices of the nearby gas cells’ H I number density, temperature, thermal plus magnetic pressure, and β. This sightline is generated in the 17-11 simulation. The red horizontal line presents the gas threshold density, which is used to define which gas cells are deemed cloud-comprising. Individual clumps are depicted as red areas under the density profile. The vector field in the second panel displays the velocity field of the gas. The colors indicate inflowing high-velocity gas (vLSR ≤ −100 km s−1) in blue and outflowing high-velocity gas (vLSR ≥ 100 km s−1) in red.
Current usage metrics show cumulative count of Article Views (full-text article views including HTML views, PDF and ePub downloads, according to the available data) and Abstracts Views on Vision4Press platform.
Data correspond to usage on the plateform after 2015. The current usage metrics is available 48-96 hours after online publication and is updated daily on week days.
Initial download of the metrics may take a while.