Open Access
Fig. A.1
Download original image
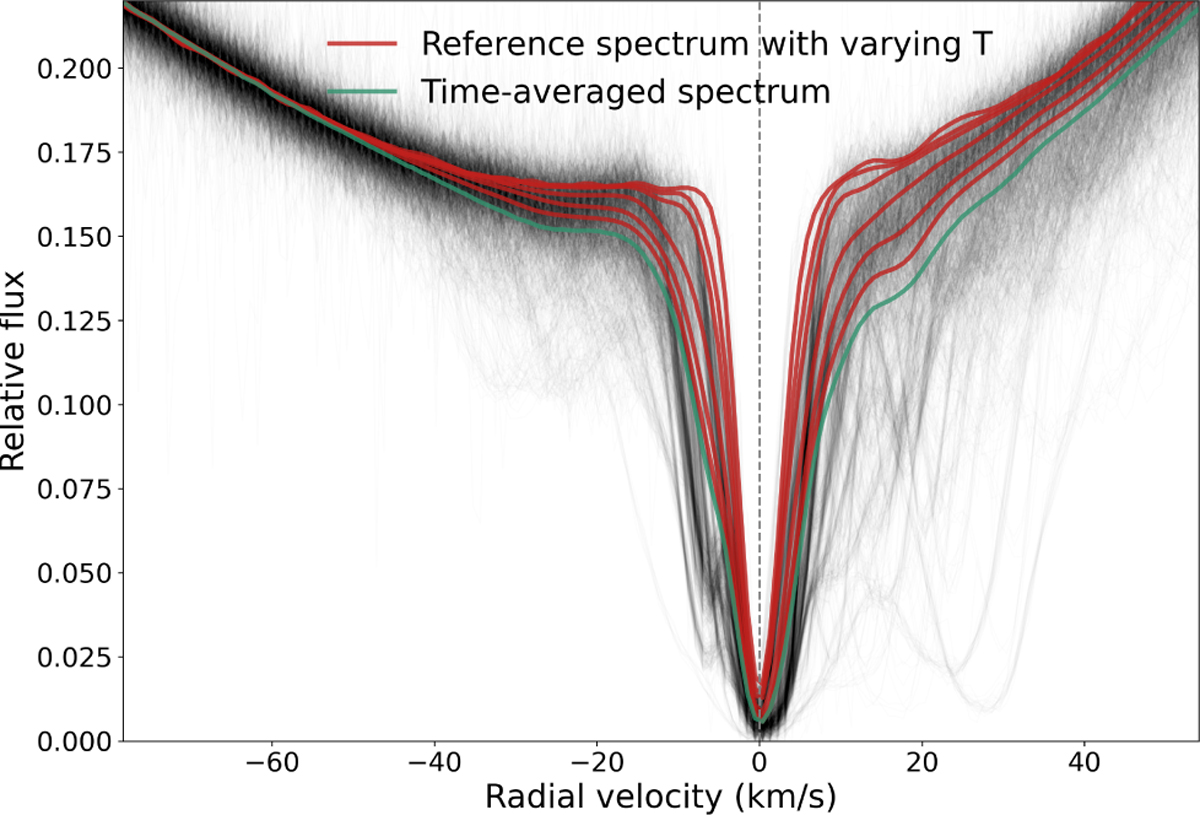
Comparison of the reference spectrum (red) computed for varying values of the threshold T as the ninety-eighth, ninetieth, eightieth, fiftieth, twenty-fifth, or tenth percentile (red lines from top to bottom). The time-average spectrum is shown in green, corresponding to the zeroth percentile reference spectrum.
Current usage metrics show cumulative count of Article Views (full-text article views including HTML views, PDF and ePub downloads, according to the available data) and Abstracts Views on Vision4Press platform.
Data correspond to usage on the plateform after 2015. The current usage metrics is available 48-96 hours after online publication and is updated daily on week days.
Initial download of the metrics may take a while.