Fig. 6
Download original image
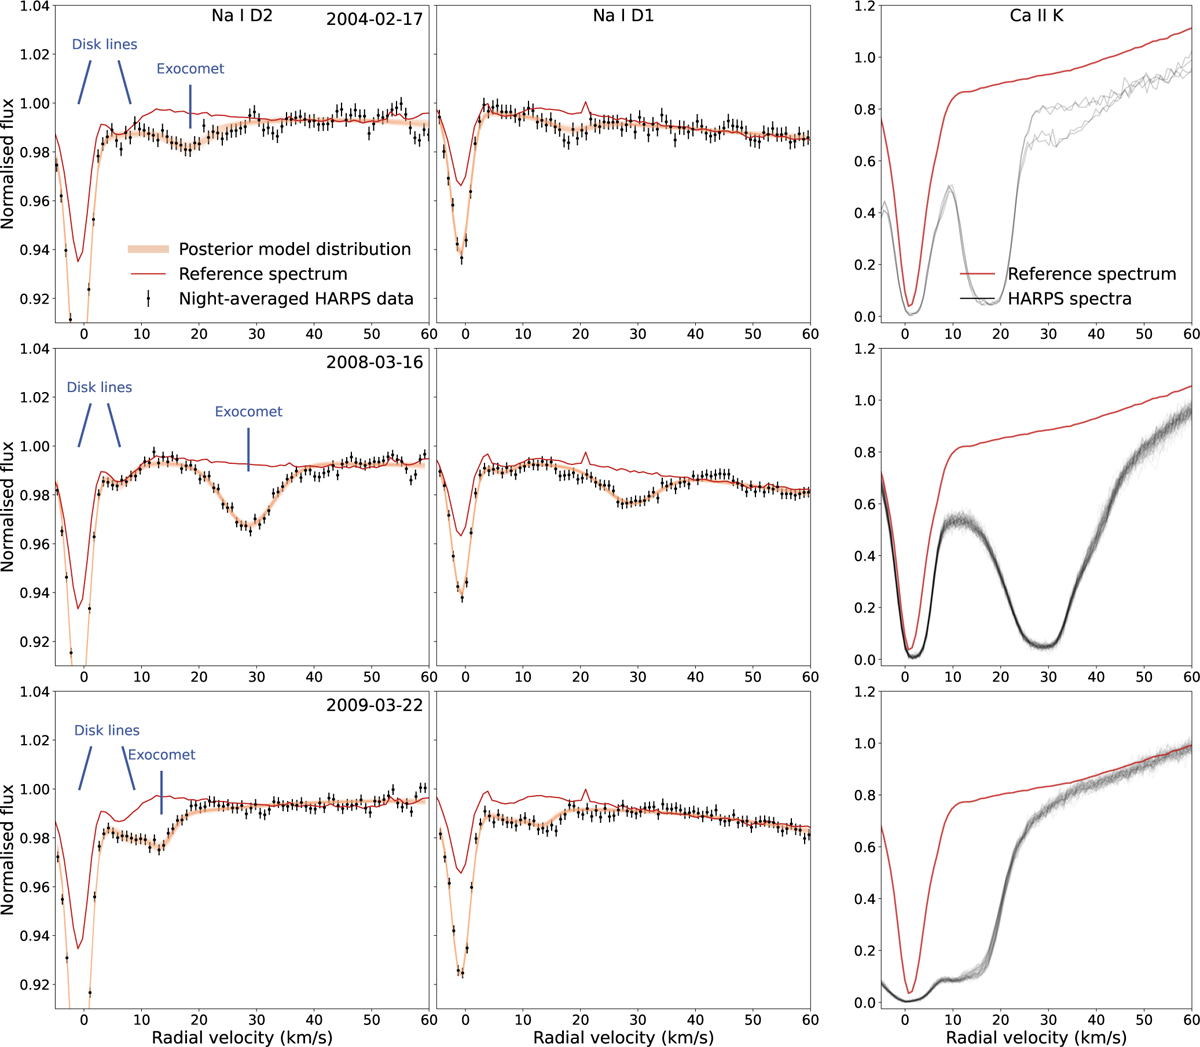
Best-fit models to the NaI D lines (left and middle columns) on three nights of data (top, middle, and bottom rows), compared to the CaII K line (right column). The night of March 17, 2008, (middle row) shows the strongest absorption of exocometary sodium of all 198 nights of data. The night of February 17, 2004, is part of a sequence of 13 nights in which weak exocometary sodium absorption persists, and this is the night with the best detectability of this sequence but the weakest exocometary signal detected in the entire dataset. The posterior parameter distributions of this fit are shown in Fig. 7 as a representative example. In all three cases, the exocometary sodium absorption occurs simultaneously with strong Ca II absorption at the same relative radial velocity – indicating that the sodium is sublimated together with calcium by the same exocomets.
Current usage metrics show cumulative count of Article Views (full-text article views including HTML views, PDF and ePub downloads, according to the available data) and Abstracts Views on Vision4Press platform.
Data correspond to usage on the plateform after 2015. The current usage metrics is available 48-96 hours after online publication and is updated daily on week days.
Initial download of the metrics may take a while.