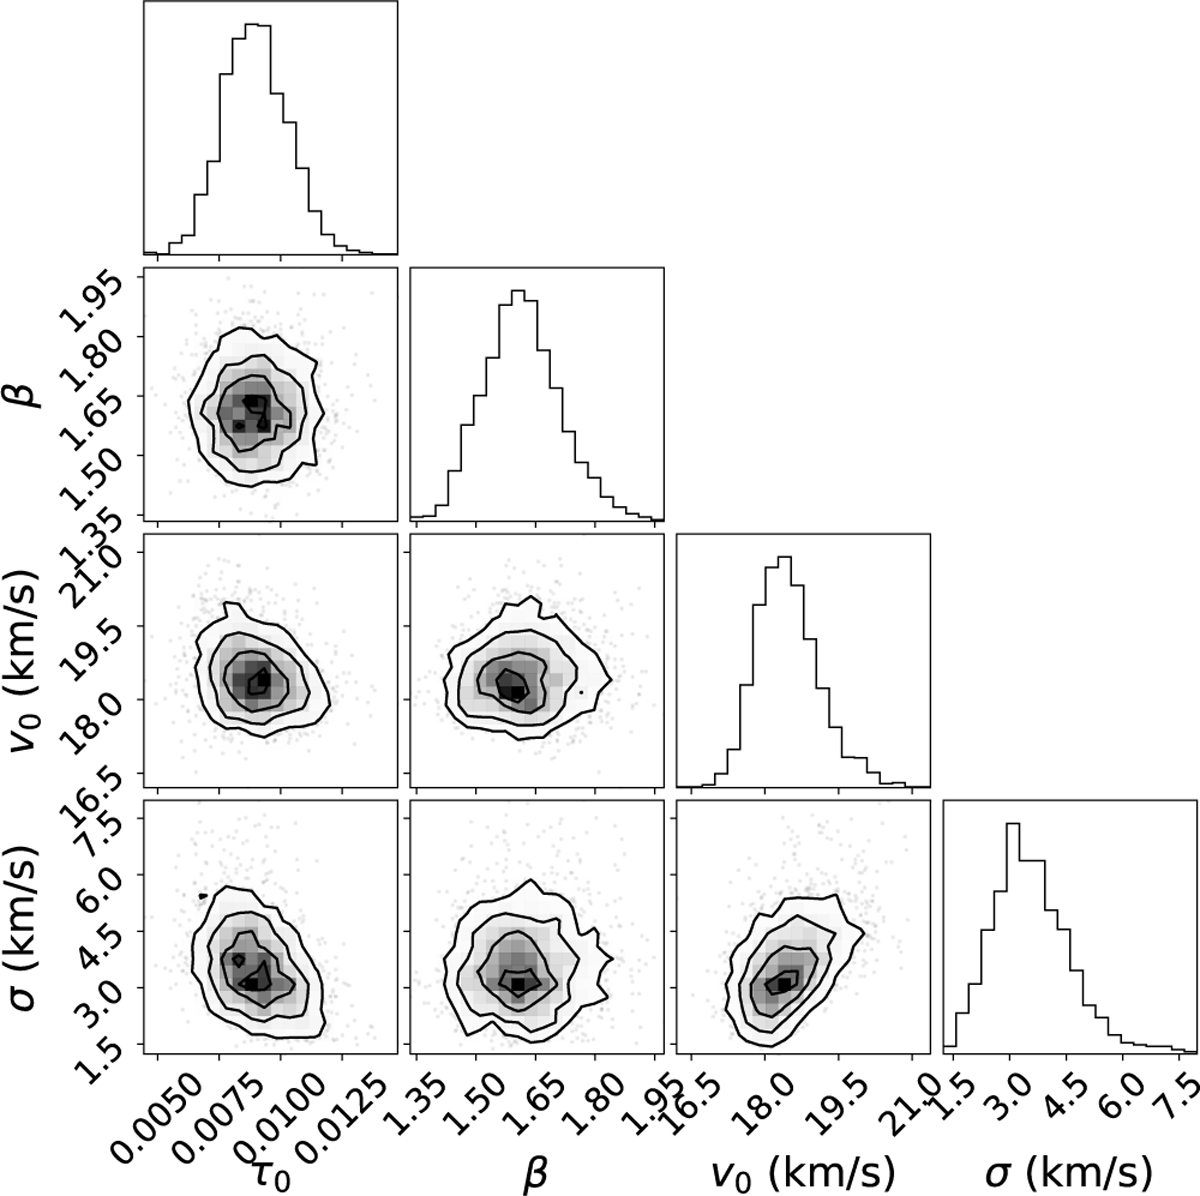
Fig. 7
Download original image
Posterior distributions of the parameters that describe the exo-cometary sodium lines on the night of February 17, 2004, shown in Fig. 6. Because the observed Na I lines are highly optically thin, τ0 and f were not independently constrained. Instead, we fixed f to 1 and converted τ0 into line depth D, which is constrained to 0.89 ± 0.13%. Note that β may be elevated due to unmodeled variance in the spectrum caused by residuals from the telluric correction process.
Current usage metrics show cumulative count of Article Views (full-text article views including HTML views, PDF and ePub downloads, according to the available data) and Abstracts Views on Vision4Press platform.
Data correspond to usage on the plateform after 2015. The current usage metrics is available 48-96 hours after online publication and is updated daily on week days.
Initial download of the metrics may take a while.