Open Access
Fig. 10.
Download original image
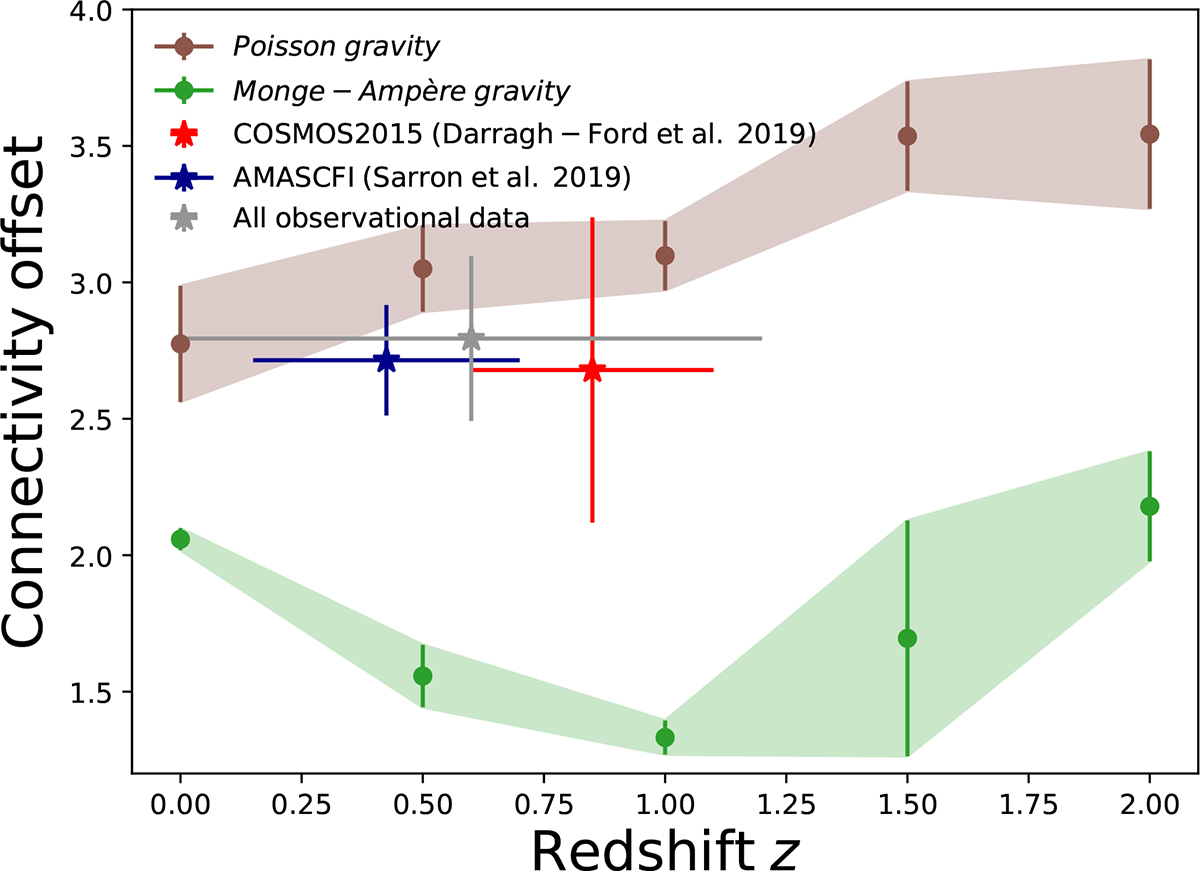
Connectivity offset as a function of redshift for Mvir = 1014 M⊙. For simulations, measurements within one and two times the virial radius are still considered as error bars. The grey point corresponds to the offset that takes into account all the observable data from Table 1.
Current usage metrics show cumulative count of Article Views (full-text article views including HTML views, PDF and ePub downloads, according to the available data) and Abstracts Views on Vision4Press platform.
Data correspond to usage on the plateform after 2015. The current usage metrics is available 48-96 hours after online publication and is updated daily on week days.
Initial download of the metrics may take a while.