Fig. 11.
Download original image
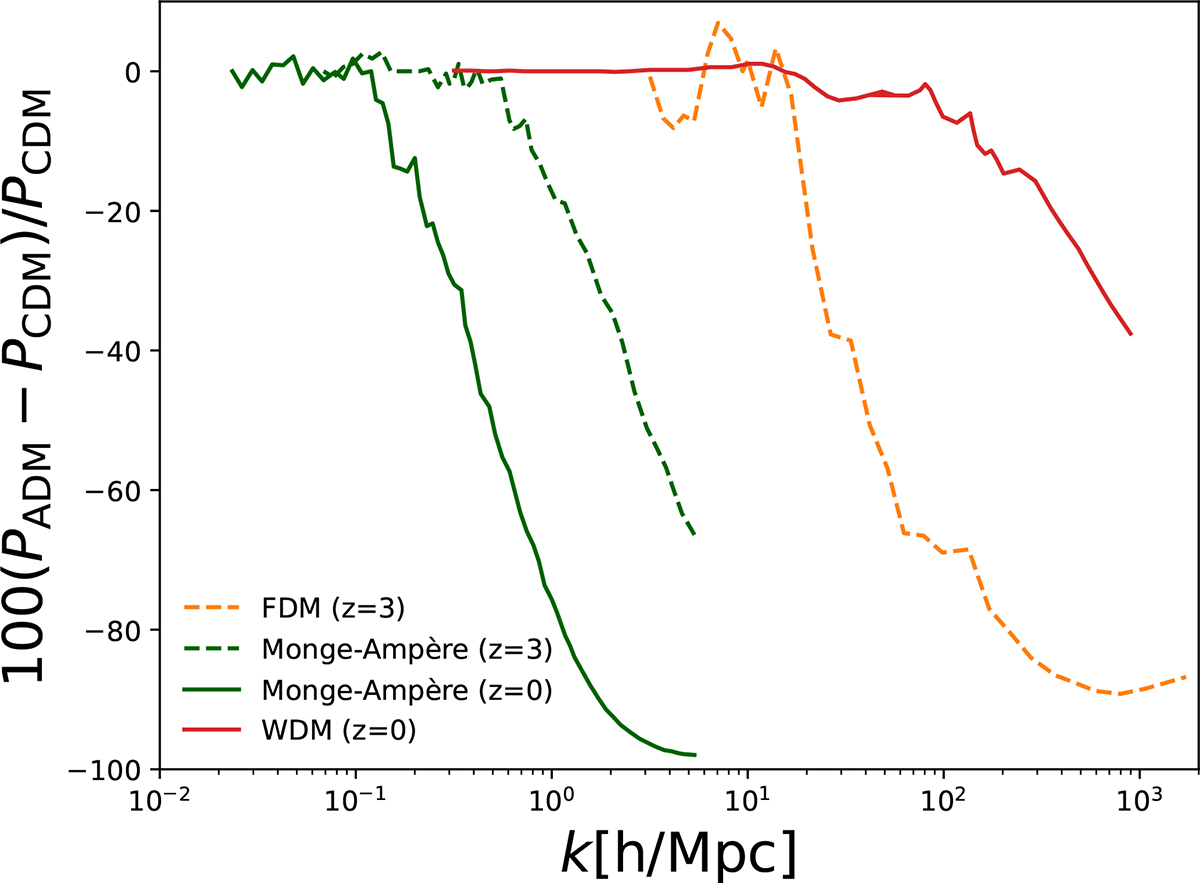
Percentage difference between alternative DM theories (ADM) and CDM power spectra. The power spectra data for FDM and WDM are from May & Springel (2023) and Viel et al. (2012) with a DM mass parameter of 2.5 × 10⁻²² eV and 2 keV at z = 3 and z = 0, respectively. The cut-offs observed in WDM and FDM, similar to those in the Monge-Ampère model but occurring at different scales, are expected to induce differences in halo connectivity compared to CDM.
Current usage metrics show cumulative count of Article Views (full-text article views including HTML views, PDF and ePub downloads, according to the available data) and Abstracts Views on Vision4Press platform.
Data correspond to usage on the plateform after 2015. The current usage metrics is available 48-96 hours after online publication and is updated daily on week days.
Initial download of the metrics may take a while.