Open Access
Fig. 5.
Download original image
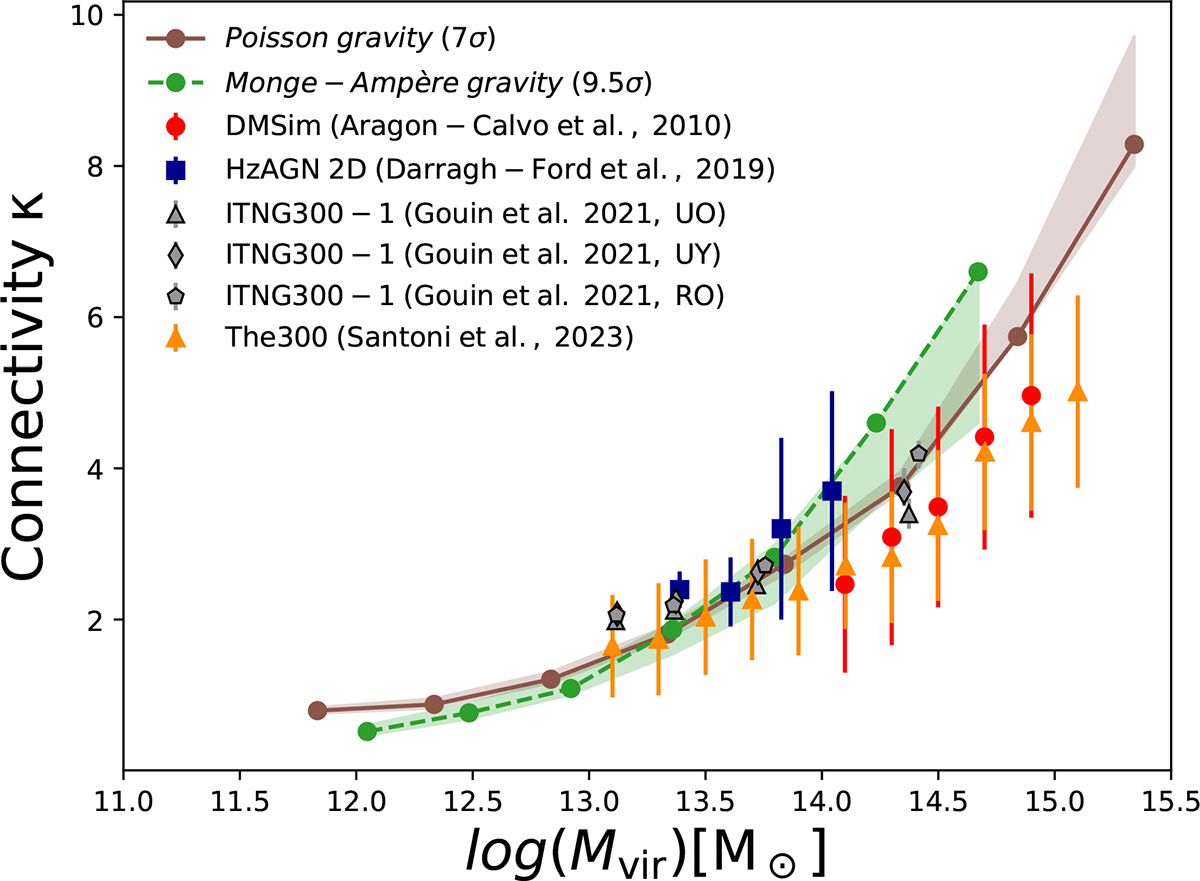
Connectivity plotted against halo mass based on DM density distributions at z = 0 with rvir-2rvir band. Table 1 provides details on the simulated data in the literature. Data from Gouin et al. (2021) are displayed for different dynamical states of galaxies.
Current usage metrics show cumulative count of Article Views (full-text article views including HTML views, PDF and ePub downloads, according to the available data) and Abstracts Views on Vision4Press platform.
Data correspond to usage on the plateform after 2015. The current usage metrics is available 48-96 hours after online publication and is updated daily on week days.
Initial download of the metrics may take a while.