Fig. 1.
Download original image
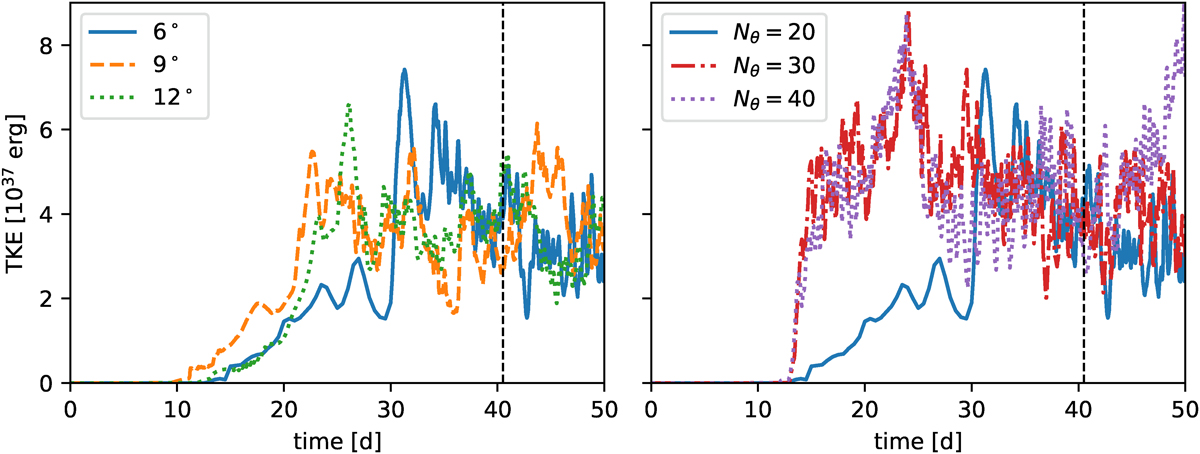
Time evolution of the total turbulent kinetic energy (TKE). Left panel: Comparison of the TKE evolution for different opening angles with resolution of Δθ = 0.3°. The models are v036_6_150x20 (blue solid line), v036_9_150x30 (yellow dashed line), and v036_12_150x40 (green dotted line). Right panel: Same as left panel, but with the same opening angle (θwith = 6°) and different resolutions: v036_6_150x20 (blue solid line), v036_6_150x30 (red dash-dotted line), and v036_6_150x40 (purple dotted line). The vertical dashed line denotes the end of τrelax and the start of τstat.
Current usage metrics show cumulative count of Article Views (full-text article views including HTML views, PDF and ePub downloads, according to the available data) and Abstracts Views on Vision4Press platform.
Data correspond to usage on the plateform after 2015. The current usage metrics is available 48-96 hours after online publication and is updated daily on week days.
Initial download of the metrics may take a while.