Fig. 10.
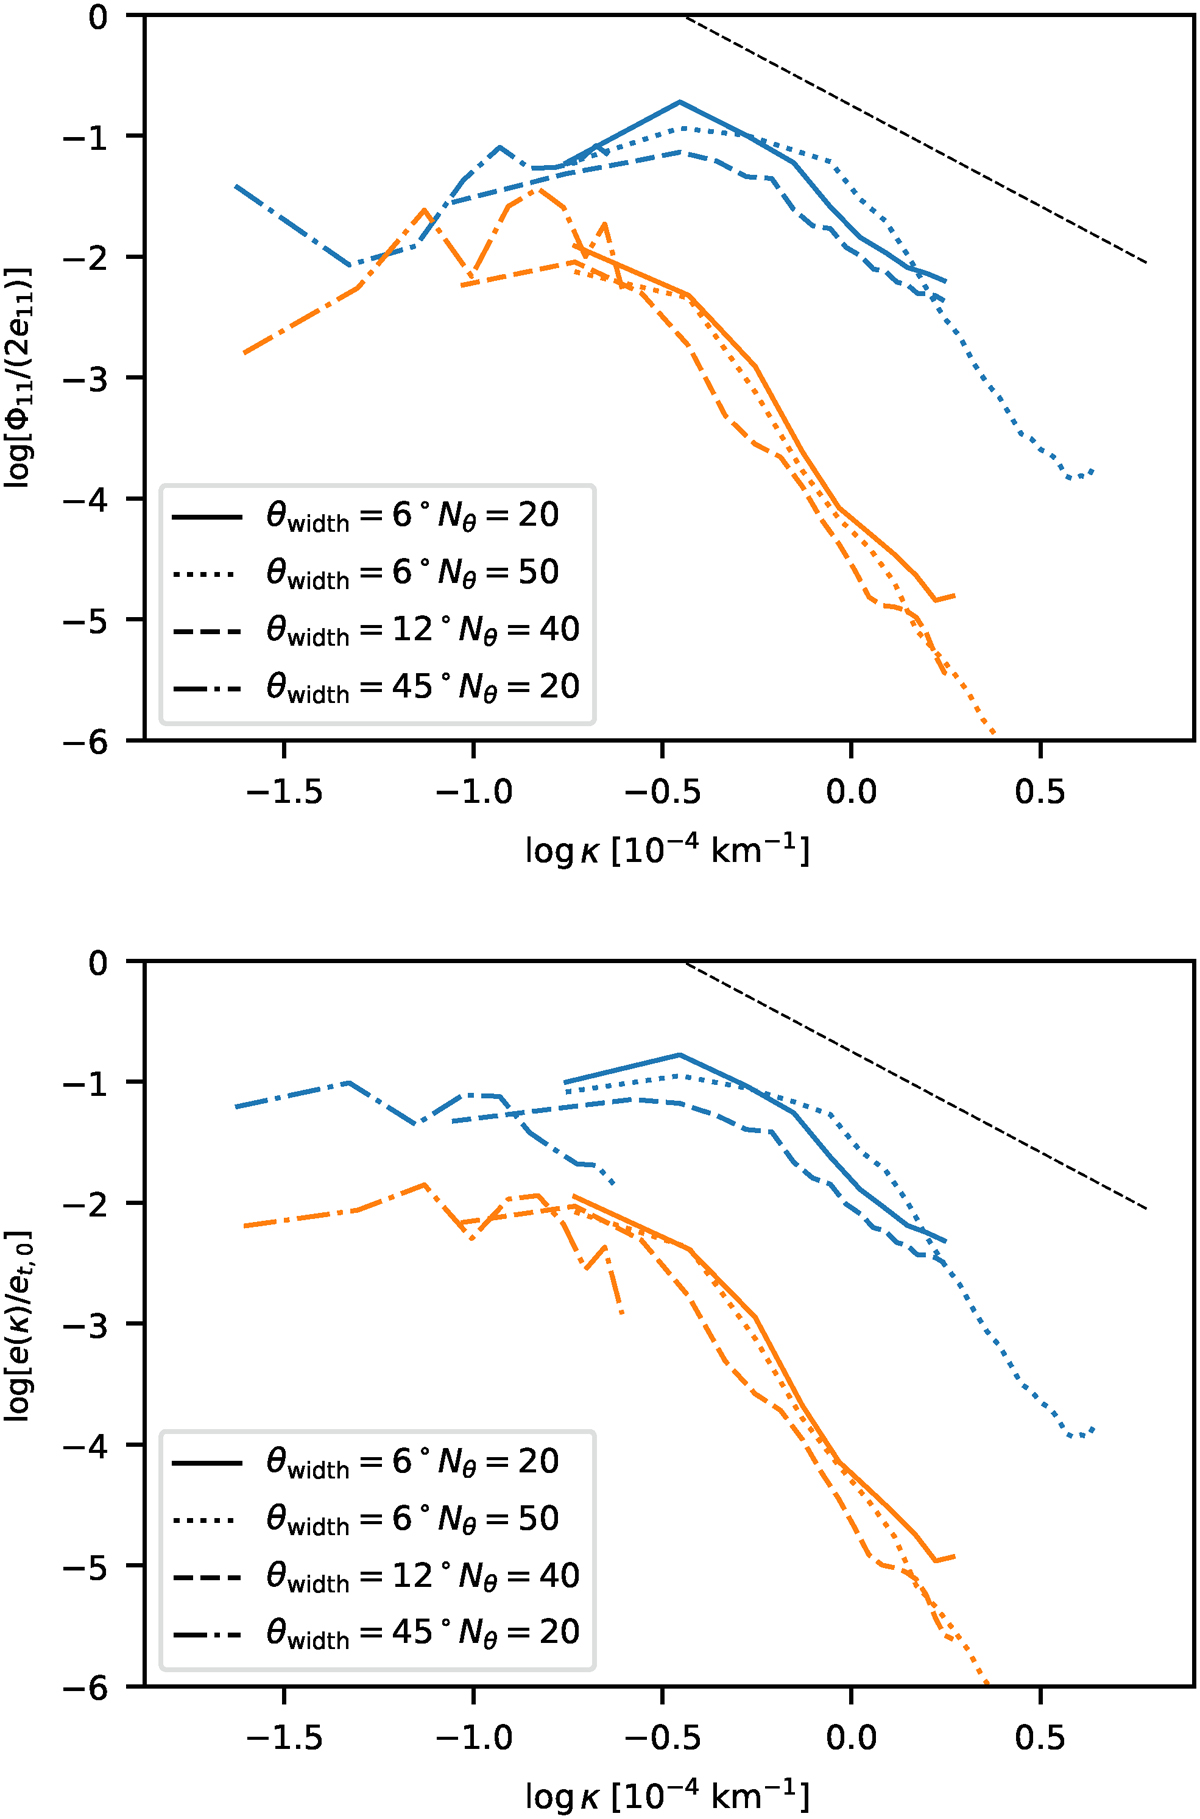
Download original image
Logarithm of the horizontal kinetic energy spectrum normalized by 2e11 (top panel) and the total normalized turbulent kinetic energy spectrum normalized by et, 0 (bottom panel) vs. the logarithm of the horizontal wave-number in the HI zone (blue) and the HeII zone (orange) for different models: v036_6_150x20 (solid line); v036_6_150x40 (dotted line); v036_12_150x60 (dashed line); v036_45_150x20 (dash-dotted line). We show the Kolmogorov −5/3 slope as a dashed black line for comparison. The low-resolution model does not show the granulation energy cascade as it is damped already at the energy maximum. Simultaneously, the amount of total kinetic energy is lower in the HeII region, and L11 and L22 are larger. Thus, the spectrum has κmax at a lower wavenumber.
Current usage metrics show cumulative count of Article Views (full-text article views including HTML views, PDF and ePub downloads, according to the available data) and Abstracts Views on Vision4Press platform.
Data correspond to usage on the plateform after 2015. The current usage metrics is available 48-96 hours after online publication and is updated daily on week days.
Initial download of the metrics may take a while.