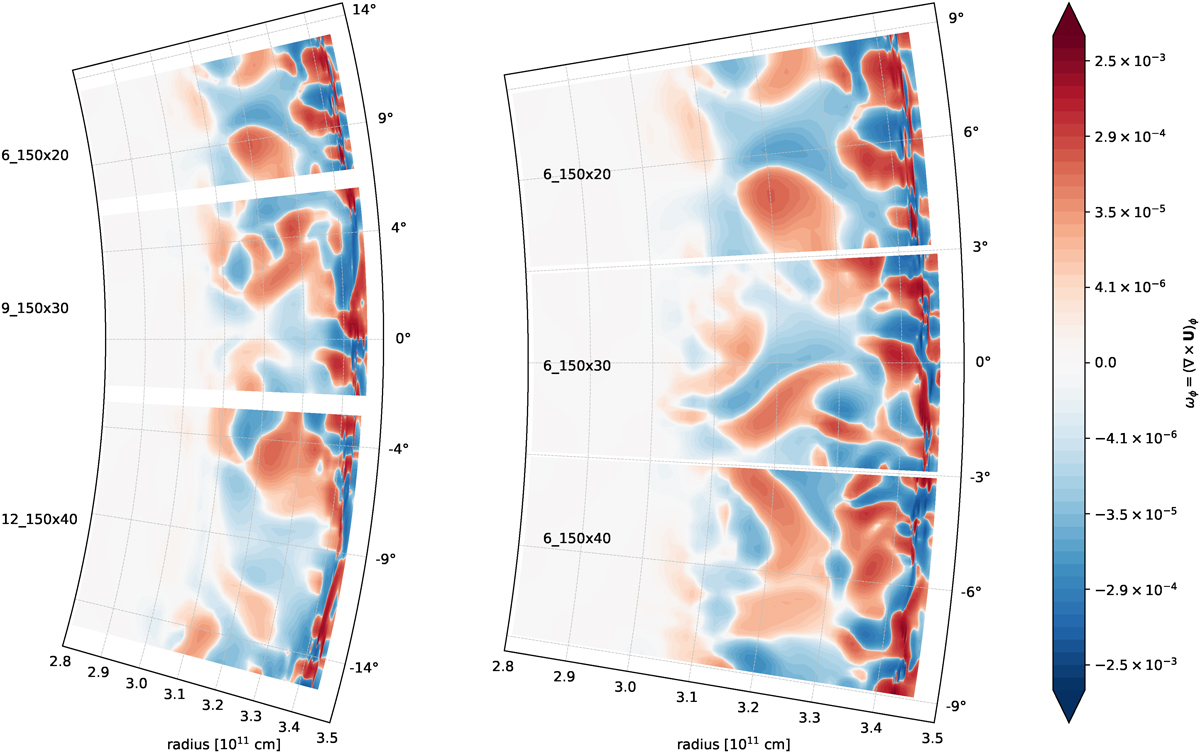
Fig. 2.
Download original image
Snapshot of five different simulations, taken at the same simulation time. The 2D simulations are in polar coordinates; the radial coordinate is in 1011 cm units; and the angular coordinates are in degrees. The color-coding denotes the vorticity of the fluid flow The simulation domains are rotated to fit on the figure. Left panel: Models v036_6_150x20 (top), v036_9_150x30 (middle), and v036_12_150x40 (bottom). These models have different angle widths, but the same resolution. Right panel: v036_6_150x20 (top), v036_6_150x30 (middle), v036_6_150x40 (bottom). These models have the same angle width, but different horizontal resolutions. In the left panel we can see that with increasing opening angle, the number of structures is also increasing in the HI region (at around 3.4 × 1011 cm radius.). In the HeII zone (at around 3.2 × 1011 cm), the size of the vortices increase. This means that the initial model with of 6° degrees used by Geroux & Deupree (2013) is inadequate to properly capture the properties of the flow structure in this area. Meanwhile, we can see on the right-hand side that the number of structures in the HI region is similar with higher resolutions (although more details appear). An animated version of this figure is available online.
Current usage metrics show cumulative count of Article Views (full-text article views including HTML views, PDF and ePub downloads, according to the available data) and Abstracts Views on Vision4Press platform.
Data correspond to usage on the plateform after 2015. The current usage metrics is available 48-96 hours after online publication and is updated daily on week days.
Initial download of the metrics may take a while.