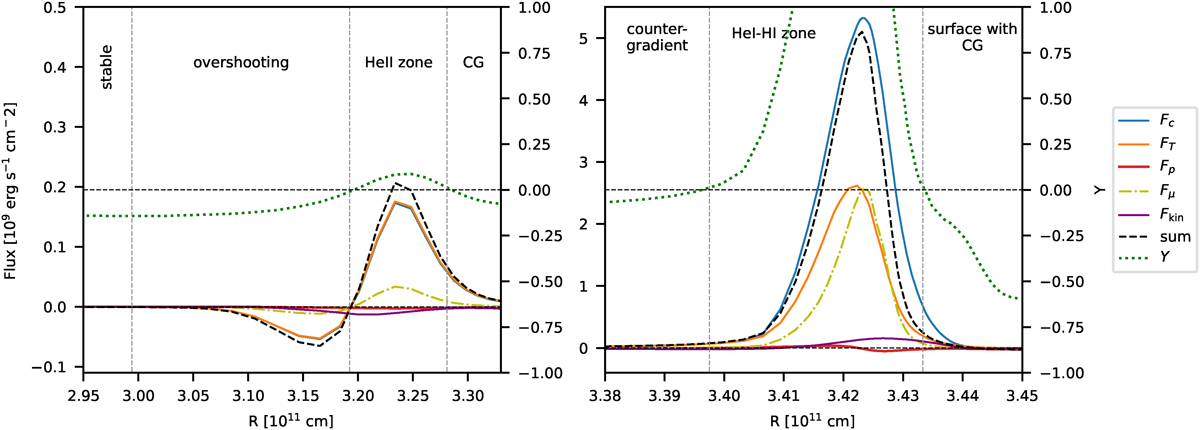
Fig. 4.
Download original image
Structure of the convective zone and the flux components. The left-hand side is the vicinity of the HeII zone, and the right-hand side is the vicinity of the HI zone. The left-hand side vertical axis is the flux, and the horizontal axis is the radius. The green dotted curve with the right-hand axis denotes the dimensionless entropy gradient. Comparing the sign of this and the convective flux (blue curve) gives the borders of the different regions, which are separated by the dashed gray vertical lines. The condition of the regions is given in Section 3, and also in Table 3. The other flux components are the temperature flux (orange curve), the pressure flux (red curve), and the ionization energy flux, Fμ (yellow dash-dotted curve). The sum of these three components gives the black dashed curve. The kinetic energy flux is shown as a purple line.
Current usage metrics show cumulative count of Article Views (full-text article views including HTML views, PDF and ePub downloads, according to the available data) and Abstracts Views on Vision4Press platform.
Data correspond to usage on the plateform after 2015. The current usage metrics is available 48-96 hours after online publication and is updated daily on week days.
Initial download of the metrics may take a while.