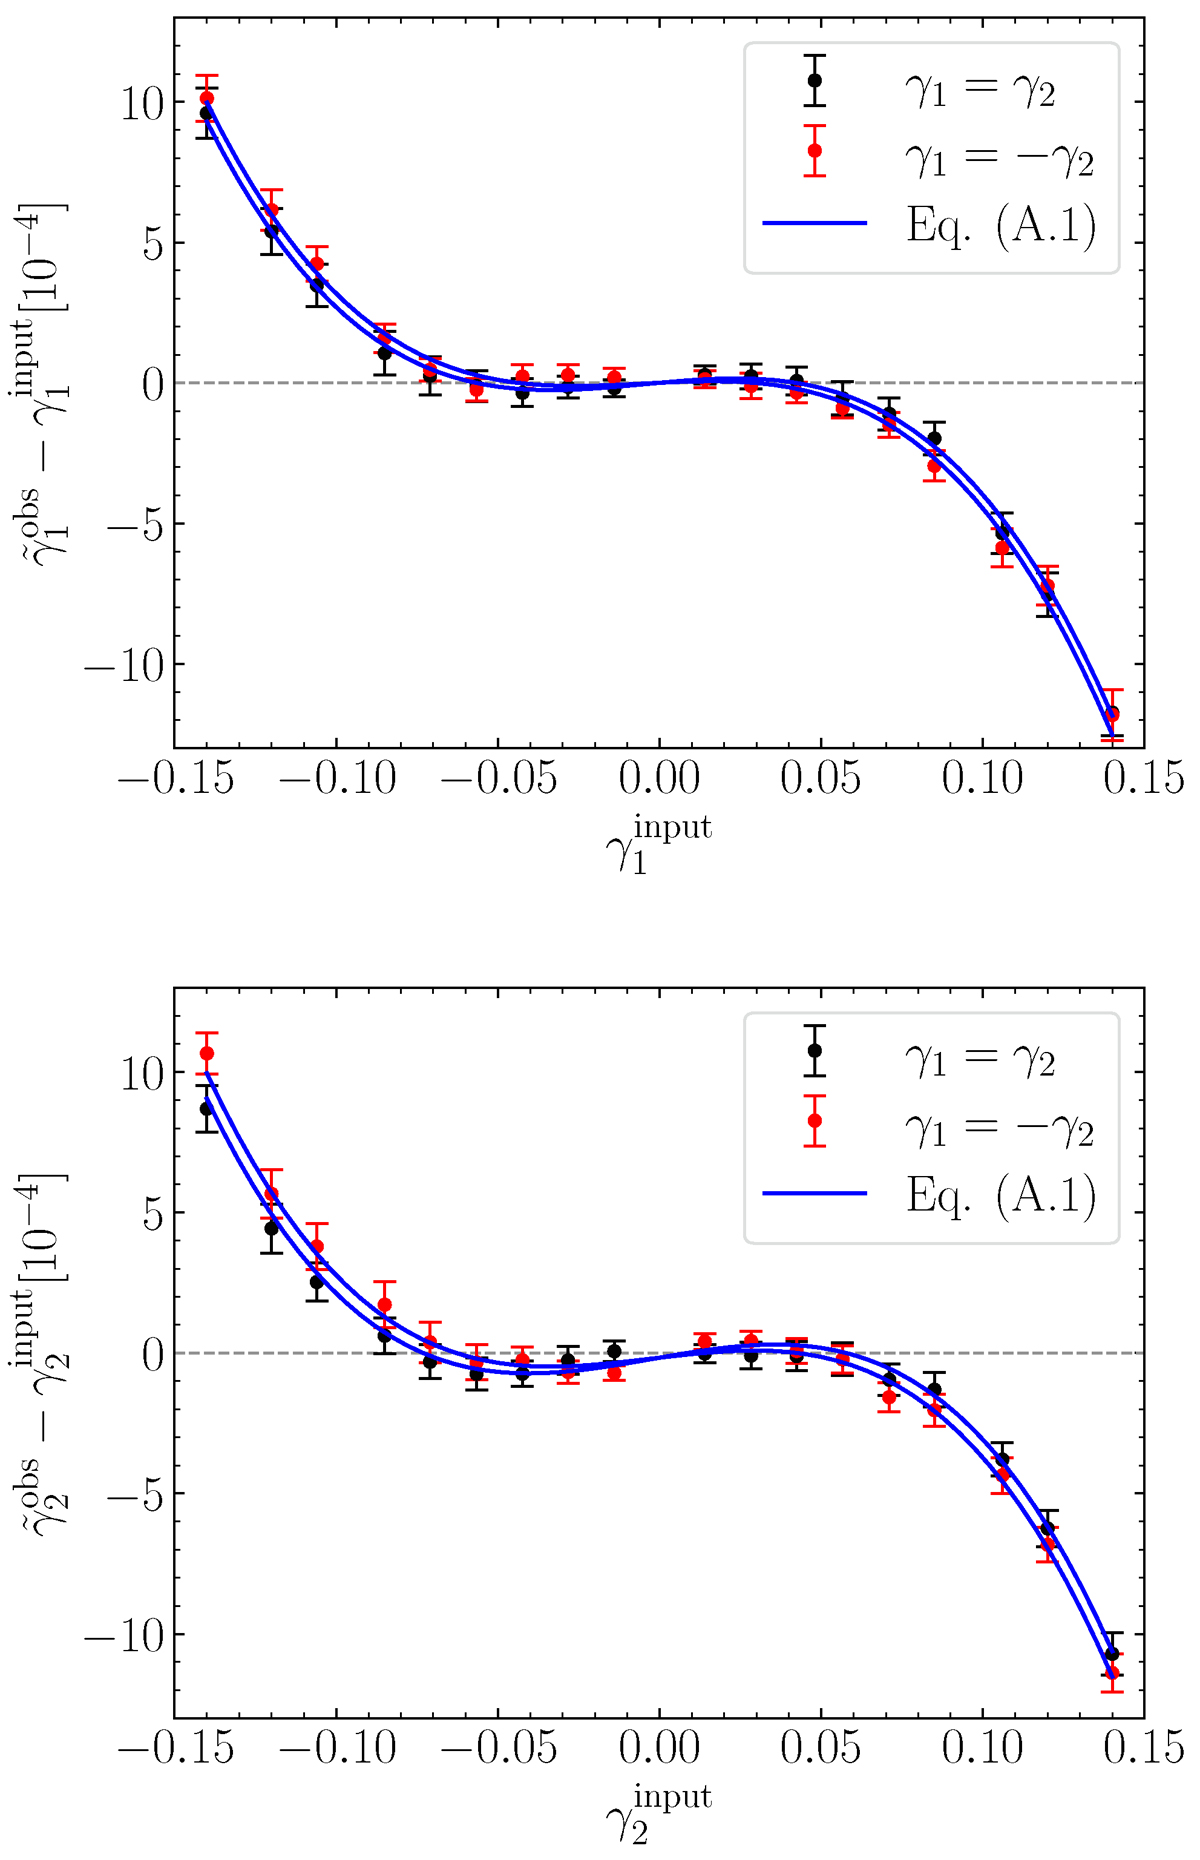
Fig. A.2.
Download original image
Difference between the estimated and input shear values as a function of the input shear. The estimated shears are corrected using the zero-shear simulations to account for correlations across different shear setups, as described in the main text. Error bars represent the uncertainties in the weighted mean estimates, calculated by bootstrapping the 18 independent shear estimates for each input shear value. The black and red points distinguish between simulations with the two shear components having the same or opposite signs. The blue lines show the fitting results of Eq. (A.1), with the constrained parameter values presented in Table A.1.
Current usage metrics show cumulative count of Article Views (full-text article views including HTML views, PDF and ePub downloads, according to the available data) and Abstracts Views on Vision4Press platform.
Data correspond to usage on the plateform after 2015. The current usage metrics is available 48-96 hours after online publication and is updated daily on week days.
Initial download of the metrics may take a while.