Fig. 4.
Download original image
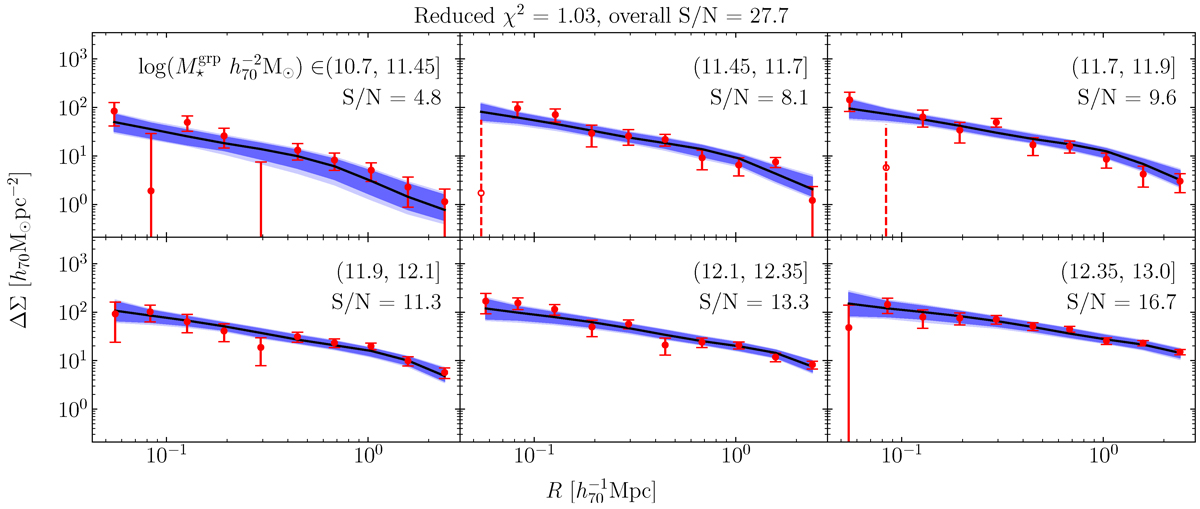
Stacked ESD profiles in the six bins of group total stellar mass (![]() ). The error bars correspond to the square root of the diagonal elements of the covariance matrix. We use open circles with dashed bars for negative values of the ESD. The black lines show the best-fit results from our baseline model (Sect. 5), with the shaded dark and light blue regions indicating the 68% and 95% credible intervals, respectively. The S/N for each
). The error bars correspond to the square root of the diagonal elements of the covariance matrix. We use open circles with dashed bars for negative values of the ESD. The black lines show the best-fit results from our baseline model (Sect. 5), with the shaded dark and light blue regions indicating the 68% and 95% credible intervals, respectively. The S/N for each ![]() bin only accounts for correlations within that bin across different radial bins, while the overall S/N also accounts for correlations between different
bin only accounts for correlations within that bin across different radial bins, while the overall S/N also accounts for correlations between different ![]() bins. The reduced χ2 value of 1.03 (considering 7 independent fitting parameters and 60 data points) for the best-fit results suggests an overall good fit to the data.
bins. The reduced χ2 value of 1.03 (considering 7 independent fitting parameters and 60 data points) for the best-fit results suggests an overall good fit to the data.
Current usage metrics show cumulative count of Article Views (full-text article views including HTML views, PDF and ePub downloads, according to the available data) and Abstracts Views on Vision4Press platform.
Data correspond to usage on the plateform after 2015. The current usage metrics is available 48-96 hours after online publication and is updated daily on week days.
Initial download of the metrics may take a while.