Fig. 6.
Download original image
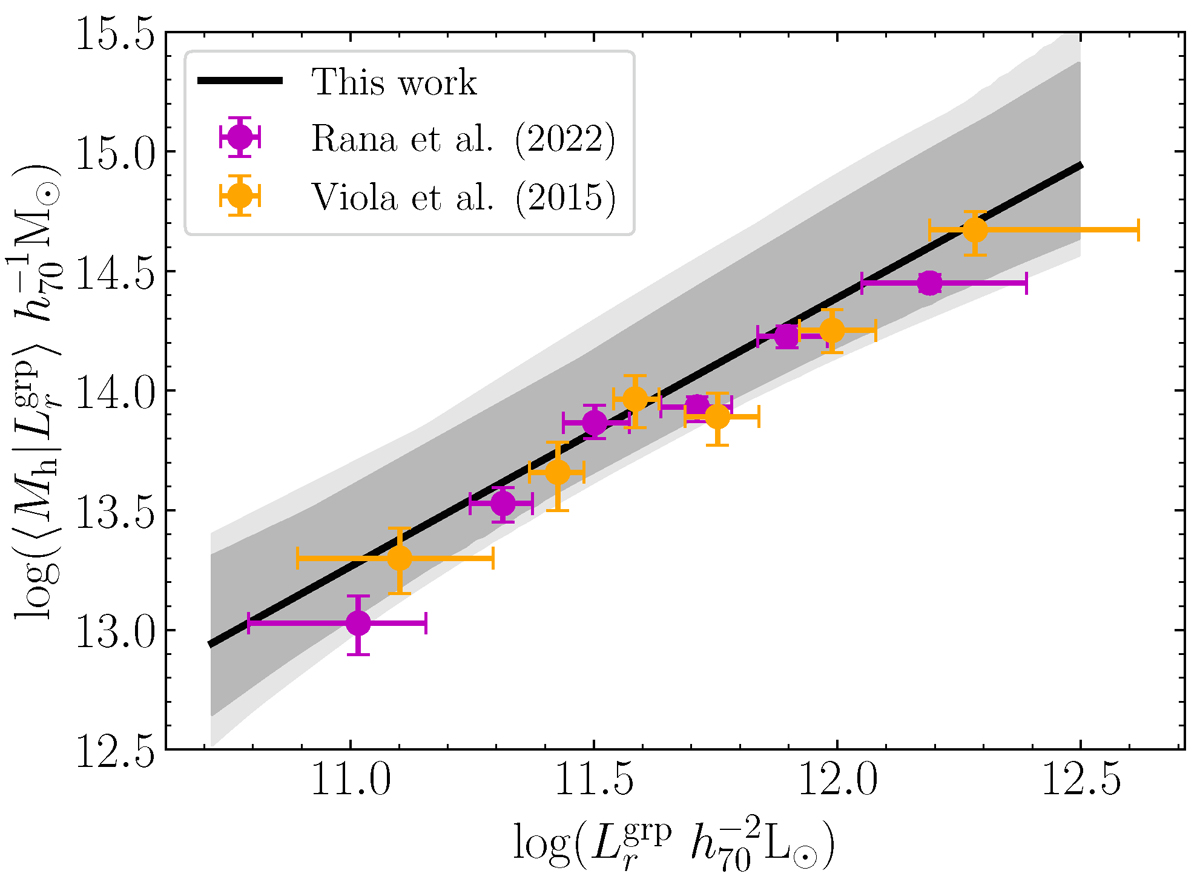
Scaling relation between the halo mass and r-band total luminosity of galaxy groups from our baseline model. The black line shows the best-fit results, with the shaded regions illustrating the corresponding 68% and 95% credible intervals. The parameter values are provided in Table 4. The results are compared to previous measurements from Viola et al. (2015) (orange points) and Rana et al. (2022) (magenta points). All three measurements are based on the GAMA group catalogue, but with different shear measurements and modelling approaches. We note that the scaling relation is demonstrated as the mean halo mass for a given luminosity.
Current usage metrics show cumulative count of Article Views (full-text article views including HTML views, PDF and ePub downloads, according to the available data) and Abstracts Views on Vision4Press platform.
Data correspond to usage on the plateform after 2015. The current usage metrics is available 48-96 hours after online publication and is updated daily on week days.
Initial download of the metrics may take a while.