Fig. 7.
Download original image
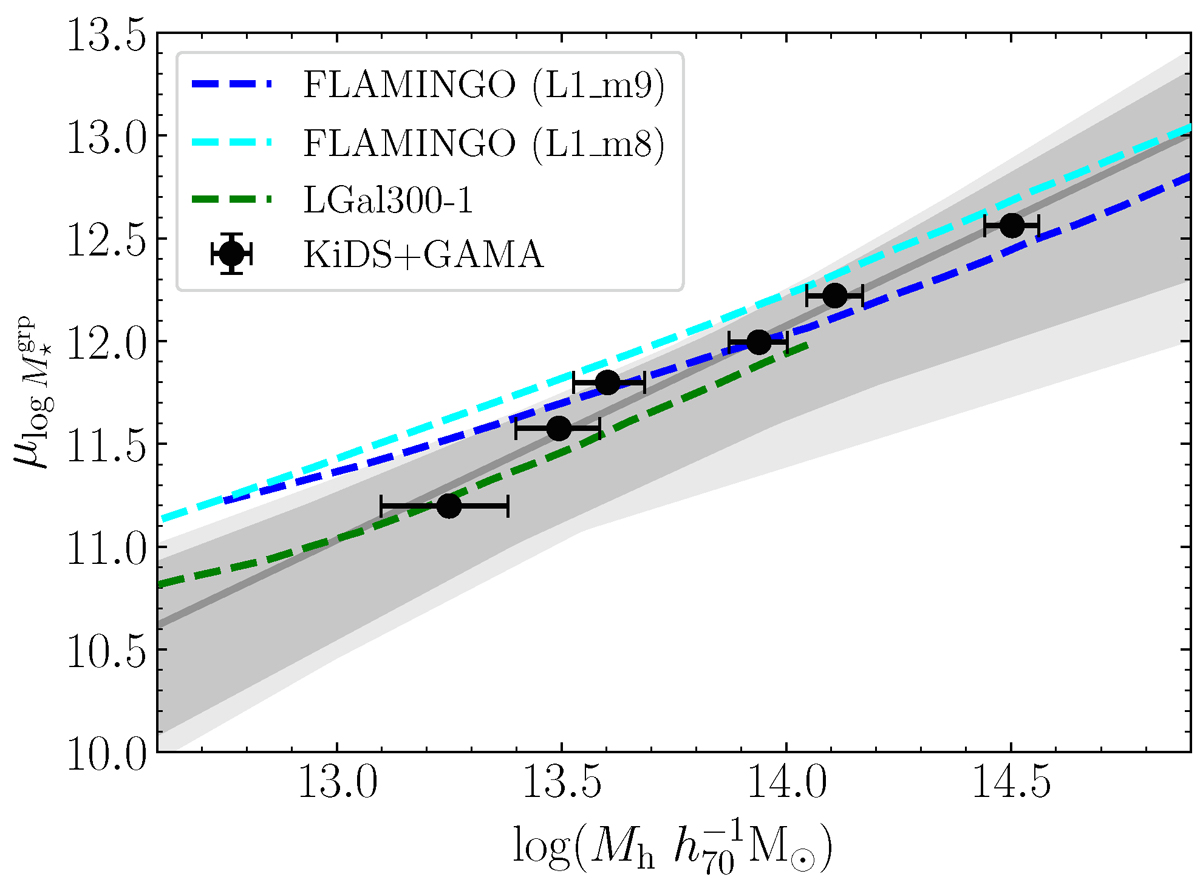
Scaling relation between the total stellar mass of galaxy groups and their halo masses from our baseline model. The grey line shows the best-fit results, with the shaded regions illustrating the corresponding 68% and 95% credible intervals. The parameter values are provided in Table 3. The black points represent the halo masses calculated by allowing As to vary for each stacked bin while fixing other parameters to their best-fit values from the joint fit. The error bars correspond to the 68% credible intervals of the new constrained As distributions. The corresponding ![]() values for these points are the mean log-stellar mass of all groups in the given stacked bin. Predictions from simulations, represented by dashed lines, are estimated from the mock catalogue built in Sect. 3. All values of
values for these points are the mean log-stellar mass of all groups in the given stacked bin. Predictions from simulations, represented by dashed lines, are estimated from the mock catalogue built in Sect. 3. All values of ![]() are converted to a h70 cosmology for comparison, with
are converted to a h70 cosmology for comparison, with ![]() from simulations scaled as
from simulations scaled as ![]() and those from observations scaled as
and those from observations scaled as ![]() . We note that the scaling relation is demonstrated as the mean log-stellar mass at a fixed halo mass.
. We note that the scaling relation is demonstrated as the mean log-stellar mass at a fixed halo mass.
Current usage metrics show cumulative count of Article Views (full-text article views including HTML views, PDF and ePub downloads, according to the available data) and Abstracts Views on Vision4Press platform.
Data correspond to usage on the plateform after 2015. The current usage metrics is available 48-96 hours after online publication and is updated daily on week days.
Initial download of the metrics may take a while.