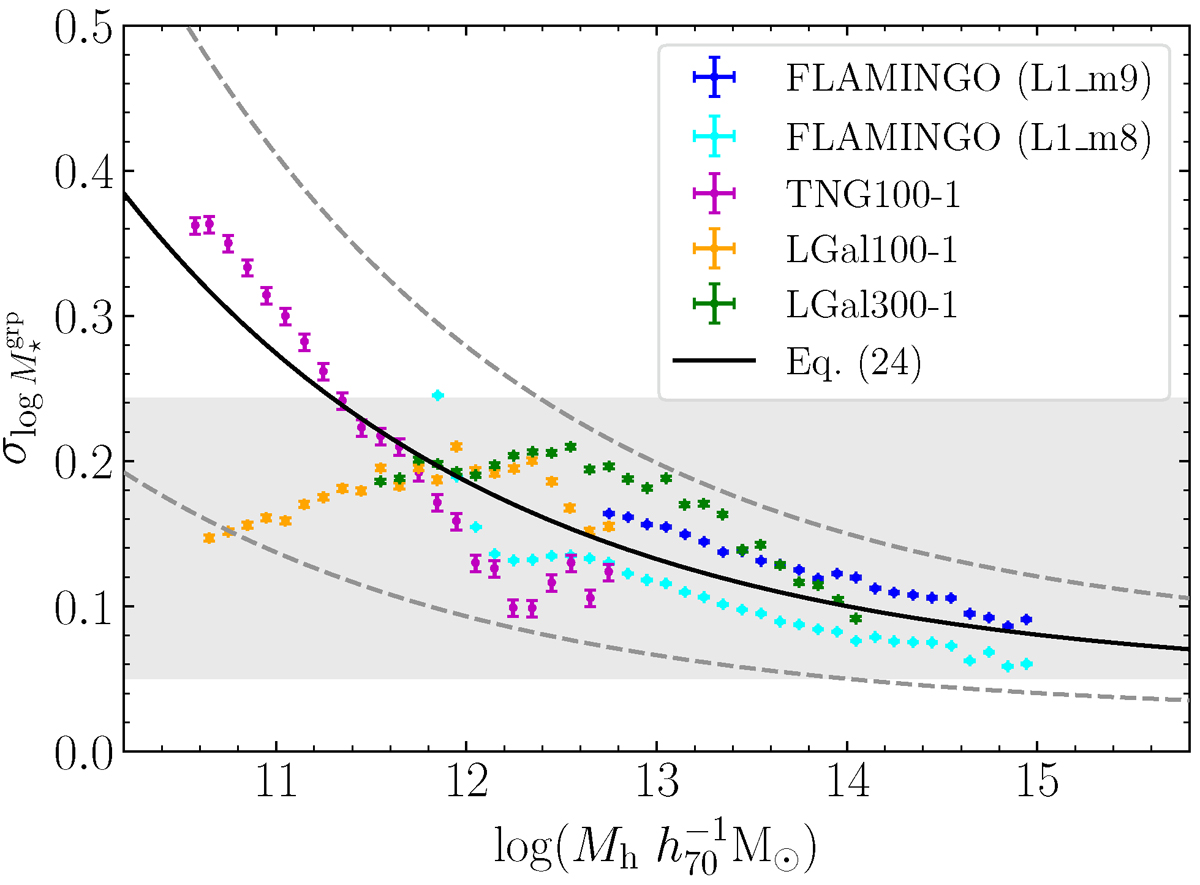
Fig. 8.
Download original image
Scatter in the group stellar mass distribution as a function of halo mass, measured from cosmological simulations. The shaded region indicates the 68% credible interval of the constant scatter constrained by our baseline model (Table 3). The solid and dashed lines represent the scatter model from Eq. (26) with Aσ set to 0.1 and 0.1 ± 0.05, respectively.
Current usage metrics show cumulative count of Article Views (full-text article views including HTML views, PDF and ePub downloads, according to the available data) and Abstracts Views on Vision4Press platform.
Data correspond to usage on the plateform after 2015. The current usage metrics is available 48-96 hours after online publication and is updated daily on week days.
Initial download of the metrics may take a while.