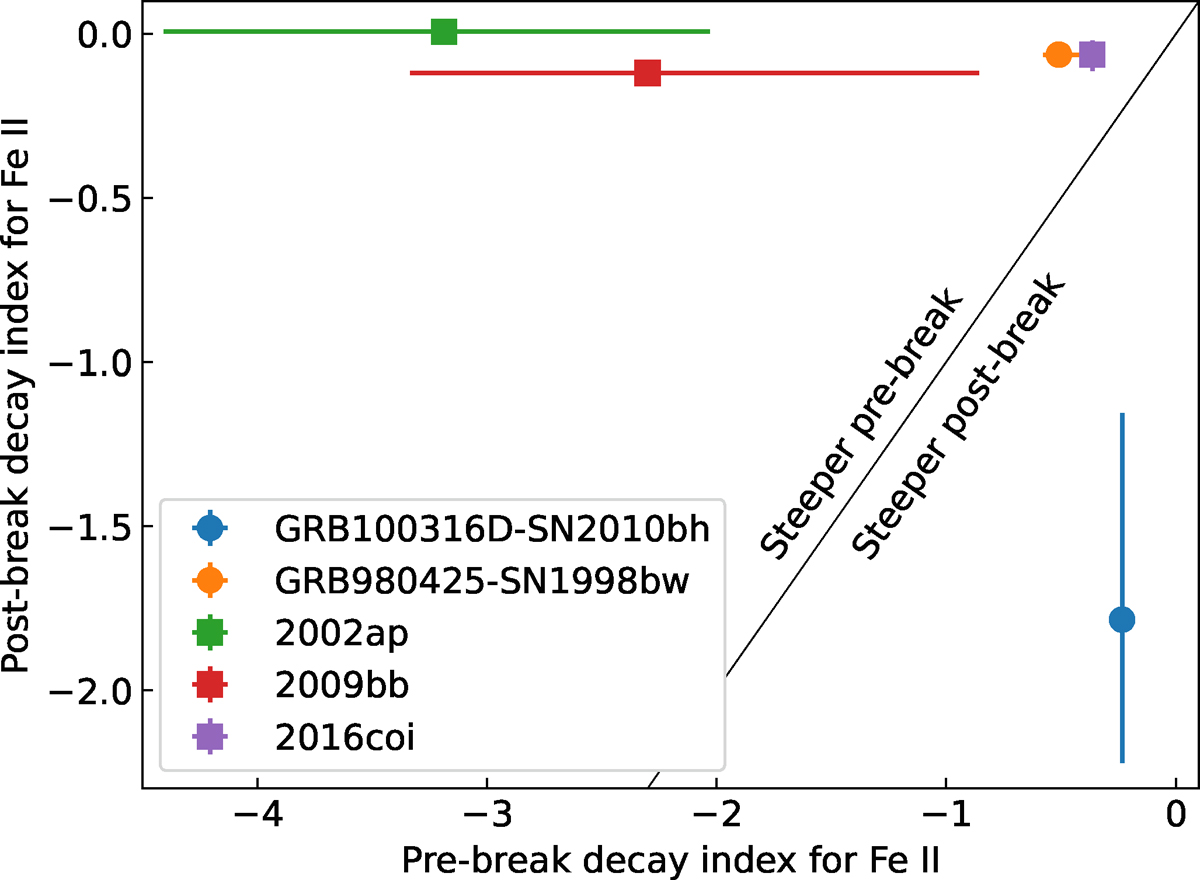
Fig. 14.
Download original image
Decay indices of Fe II pre-break and post-break. A solid black line indicates the set of points for which the pre-break and post-break Fe II decay indices are equal. Points above this line indicate that the event has a steeper pre-break velocity evolution than post-break. The majority of Fe II features studied undergo a steep-shallow break.
Current usage metrics show cumulative count of Article Views (full-text article views including HTML views, PDF and ePub downloads, according to the available data) and Abstracts Views on Vision4Press platform.
Data correspond to usage on the plateform after 2015. The current usage metrics is available 48-96 hours after online publication and is updated daily on week days.
Initial download of the metrics may take a while.