Open Access
Fig. 15.
Download original image
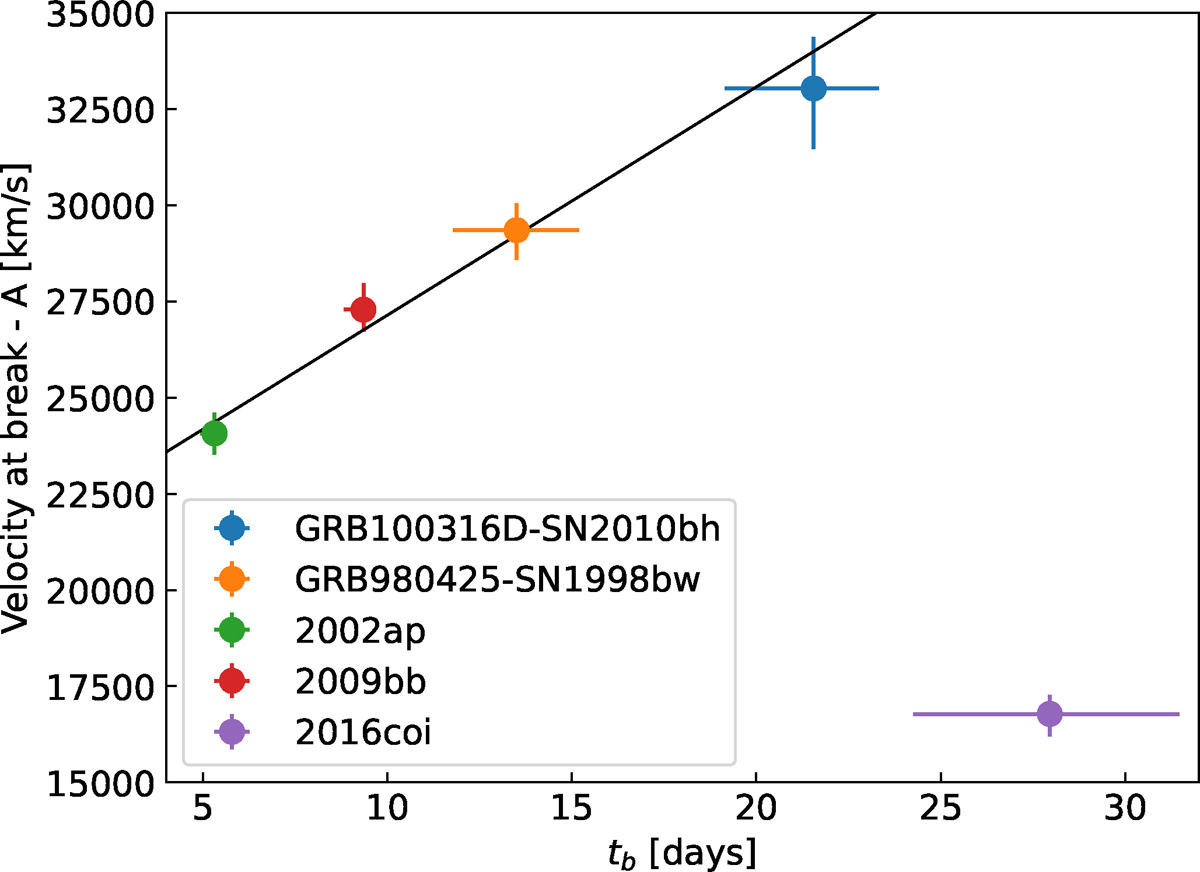
Break velocity (A) versus rest-frame break time (tb) for Fe II. The black line shows the line of best fit. A later break time implies a higher break velocity. We note that we have excluded SN2016coi from this fit.
Current usage metrics show cumulative count of Article Views (full-text article views including HTML views, PDF and ePub downloads, according to the available data) and Abstracts Views on Vision4Press platform.
Data correspond to usage on the plateform after 2015. The current usage metrics is available 48-96 hours after online publication and is updated daily on week days.
Initial download of the metrics may take a while.